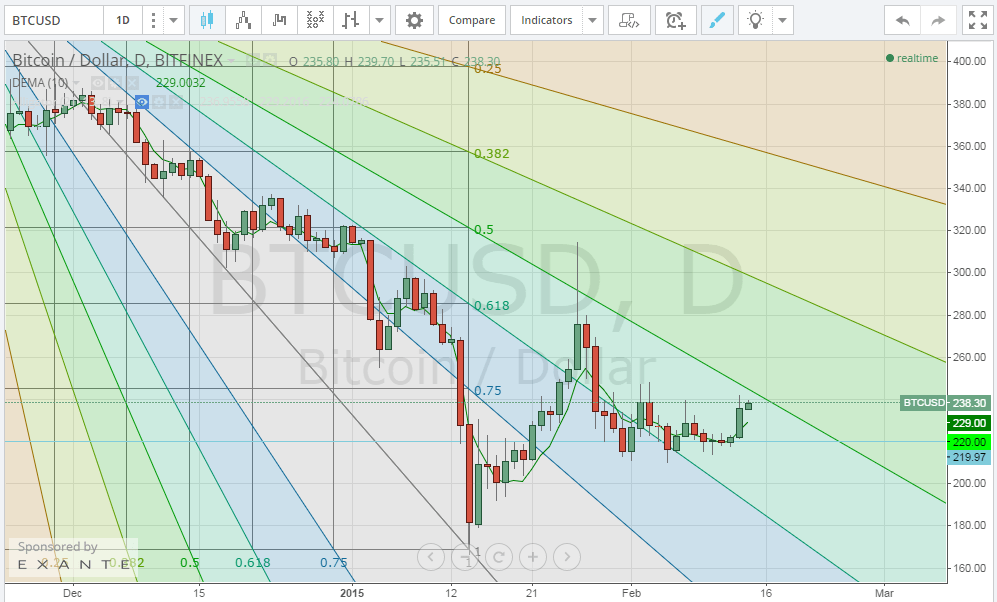
Bitcoin price increased today, just as our analysis from yesterday predicted, reaching a high of $242.54; so, we are expecting a continuation of this bullish wave to take the price up to $300 during the next few days.
By looking at the 1 day Bitfinex (BTC/USD) charts from and drawing a trend line between the high reached on the 13th of November, 2014 ($472.49) and the low reached on the 14th of January, 2015 ($167.05) and plotting the Fibonacci retracement fan accordingly, we can notice how today’s trading pulled the price up to $242.54. The new bullish wave will likely take the price up to test the 50% Fibonacci retracement fan level at around $244. In my opinion, if the bullish wave manages to raise the price above $256, we will be soon seeing the $300 level tested.
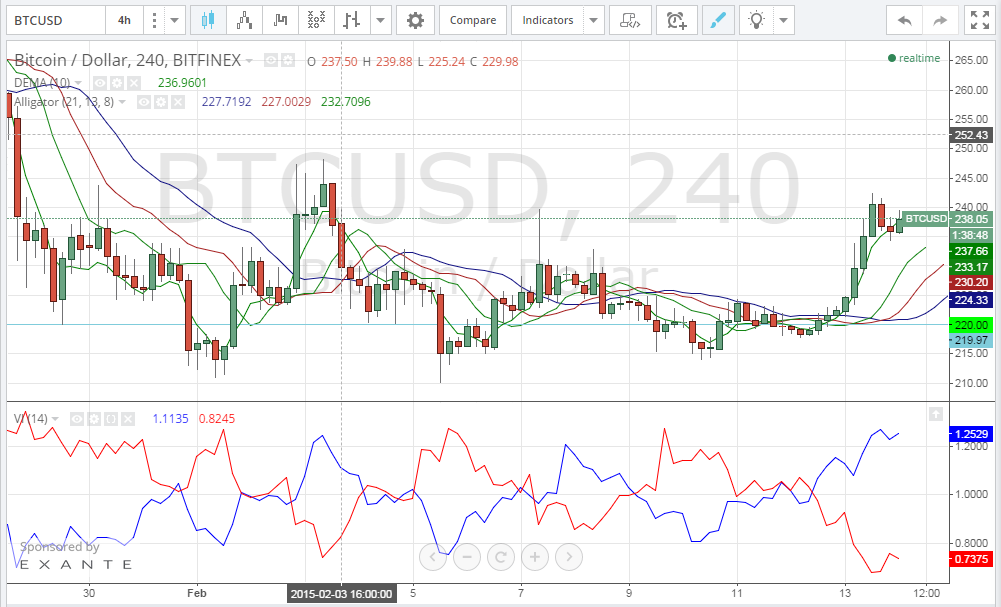
- We can see 8 successive green bullish candlesticks which confirm an increase in the market’s buying power.
- William’s Alligator moving averages are aligned in a perfect manner to confirm a continuation of the bullish wave; the red line above the blue line and the green line is above both.
- The blue uptrend line of the Vortex Indicator has crossed above the red downtrend line and the gap between both trend lines is wide and seems to be increasing, which proves how we are likely to see the bullish wave continue during the upcoming couple of days.


Comments 2