Key Highlights
- ETH price started a decent upside recovery after trading as low as $753 against the US Dollar.
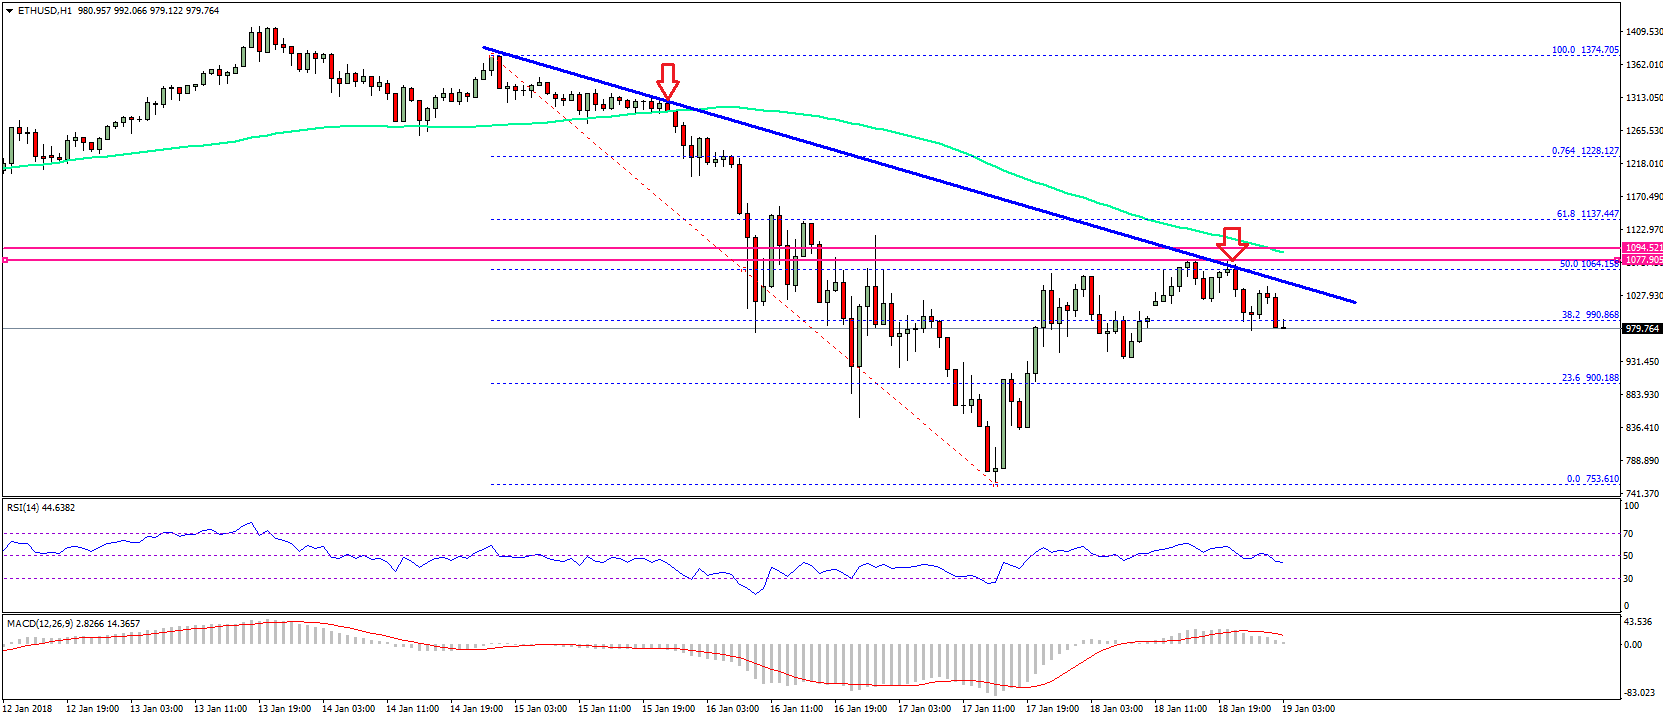
- There is a major bearish trend line with resistance at $1065 on the hourly chart of ETH/USD (data feed via SimpleFX).
- The pair is struggling to break the $1070 and $1085 resistance levels and is slowly moving down.
Ethereum price is facing an uphill task against the US Dollar and Bitcoin. ETH/USD needs to clear the $1070 and $1085 resistance levels to gain upside momentum.
Ethereum Price Resistance
Yesterday, we saw the start a decent upside recovery from the $753 swing low in ETH price against the US Dollar. The price succeeded in moving past the $800 and $1000 resistance levels. There was also a break above the 38.2% Fib retracement level of the last major decline from the $1375 high to $753 low. It cleared the path for more gains, but the price seems to be struggling to move above the $1070 and $1085 resistance levels.
There is also a major bearish trend line with resistance at $1065 on the hourly chart of ETH/USD. The trend line resistance is also around the 50% Fib retracement level of the last major decline from the $1375 high to $753 low. Therefore, the $1065 resistance level is very crucial for further upsides. More importantly, the 100 hourly simple moving average is positioned near $1085 to act as a key barriers for buyers. Once there is a proper close above the $1085 level and the 100 hourly SMA, the price may gain bids.

On the downside, an initial support is at $900. However, the current price is slightly bearish below $1065. If the pair fails to move above $1065, it could decline back toward $800.
Hourly MACD – The MACD is once again attempting to move into the bearish zone.
Hourly RSI – The RSI is now below the 50 level and is heading lower.
Major Support Level – $900
Major Resistance Level – $1065
Charts courtesy –


You can be easily hacked don’t lose guard. “skygofree” has all your data stolen and hidden
Contact: today you still can be protected and have your identity hidden.