- Ethereum price steady
- Constantinople fails to take off, vulnerabilities discovered
- Trading volumes low, ETH/USD may consolidation
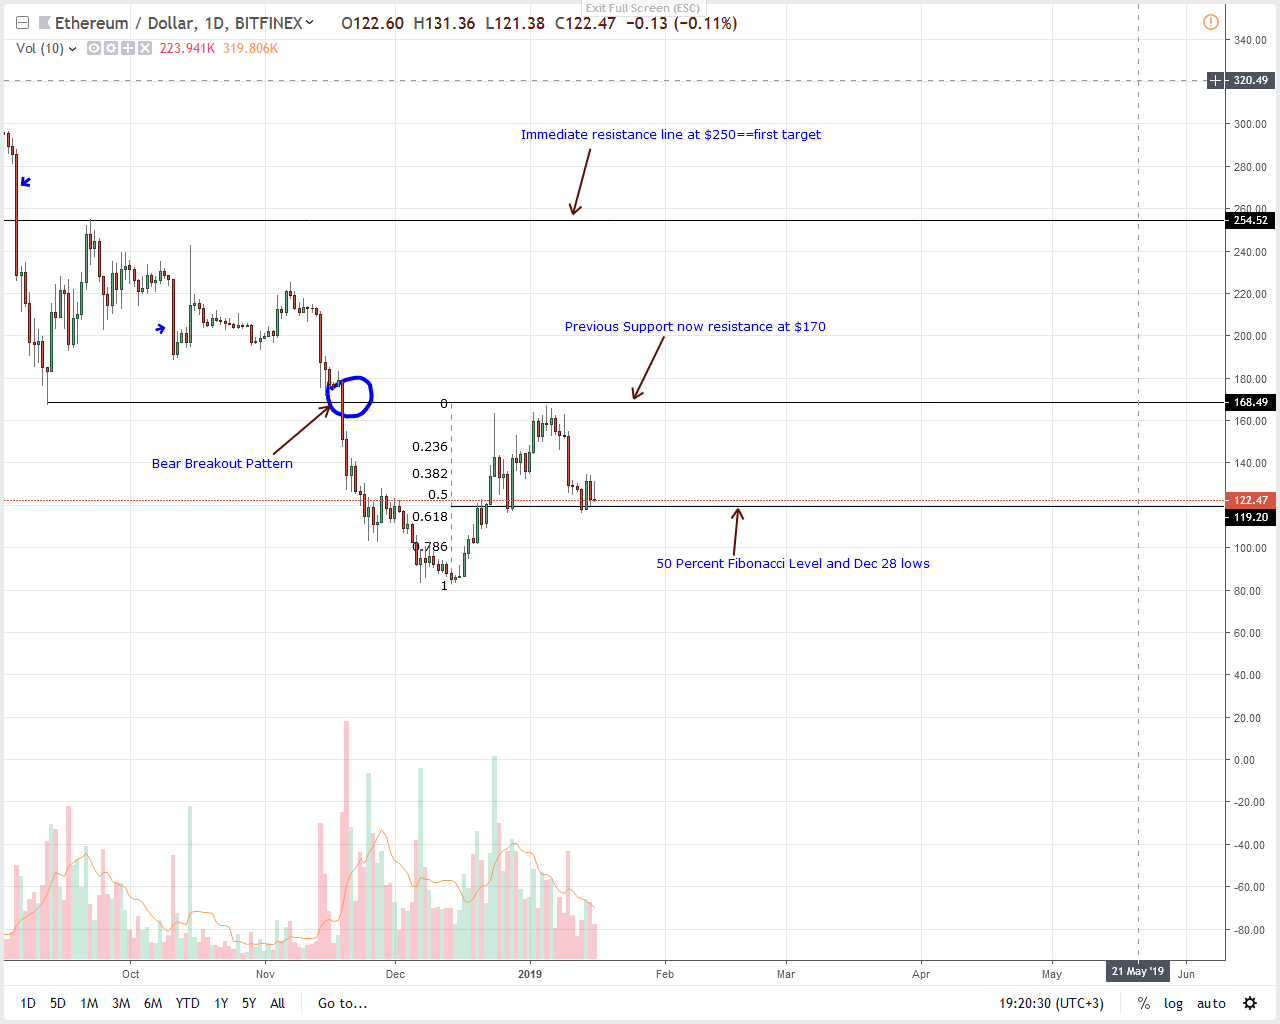
Even though Constantinople is what Ethereum needs, this is the second time the upgrade has been put off. Luckily, ETH prices are steady against the USD. Before we recommend longs, ETH must first rally above Dec 2018 highs of $170
Ethereum Price Analysis
Fundamentals
It is official, Constantinople is off. However, how the Ethereum Foundation and other developers failed to spot a weakness allowing , to successfully split open the underlying code and expose potentially catastrophic errors begs more questions than answers. A level deeper and did it take Smart Security to run analysis and publish their findings?
“Out of an abundance of caution, key stakeholders around the Ethereum community have determined that the best course of action will be to delay the planned Constantinople fork that would have occurred at block 7,080,000 on January 16, 2019.”
The security vulnerability circles around EIP , a “Net gas metering for SSTORE without dirty maps” proposal that according to an official Ethereum explanation will “makes it cheaper to do certain things on chain, especially things that are currently “excessively” expensive.” Could it have been activated, the network would have been susceptible to a Re-entrance attack.
Candlestick Arrangement

Meanwhile, ETH is down 3.5 percent and 17.8 percent in the last week but still, candlestick formation hints of underlying demand. Because Constantinople didn’t take off, there is a renewed conviction across the market that the no-hurry approach adopted might be the right course of action. All the same, our ETH projection is bullish. But until after ETH prices race above $170, conservative traders should be on the sidelines.
Note that gains above $170 nullify the bear breakout pattern set in motion by Nov 19 bears. However, in the meantime, aggressive traders can take long positions at spot prices with stops at Jan 14 lows. After all, Fibonacci retracement rules are supportive of bulls. Note that there is a double bar bull reversal pattern bouncing off the 61.8 percent Fibonacci level of Dec 2018 high low. On the other hand, losses below $120 could trigger a spiral that may see ETH crash towards $70.
Technical Indicators
Volumes are drying up. Although volumes indicate demand or supply and waning, our bullish stance directs that for buyers to be in control, then there must be impressive rally thrusting prices above Jan 10 highs. Then again, this rally should be supported by high trade volumes exceeding 684k of Jan 10. It can even surpass those behind the ecstatic sell-off of Nov 20—1.5 million. Otherwise, ETH consolidation may continue.


