- Ripple prices in range mode
- Fuzzy regulations impede XRP adoption.
- Transactions volumes drop, prices dip
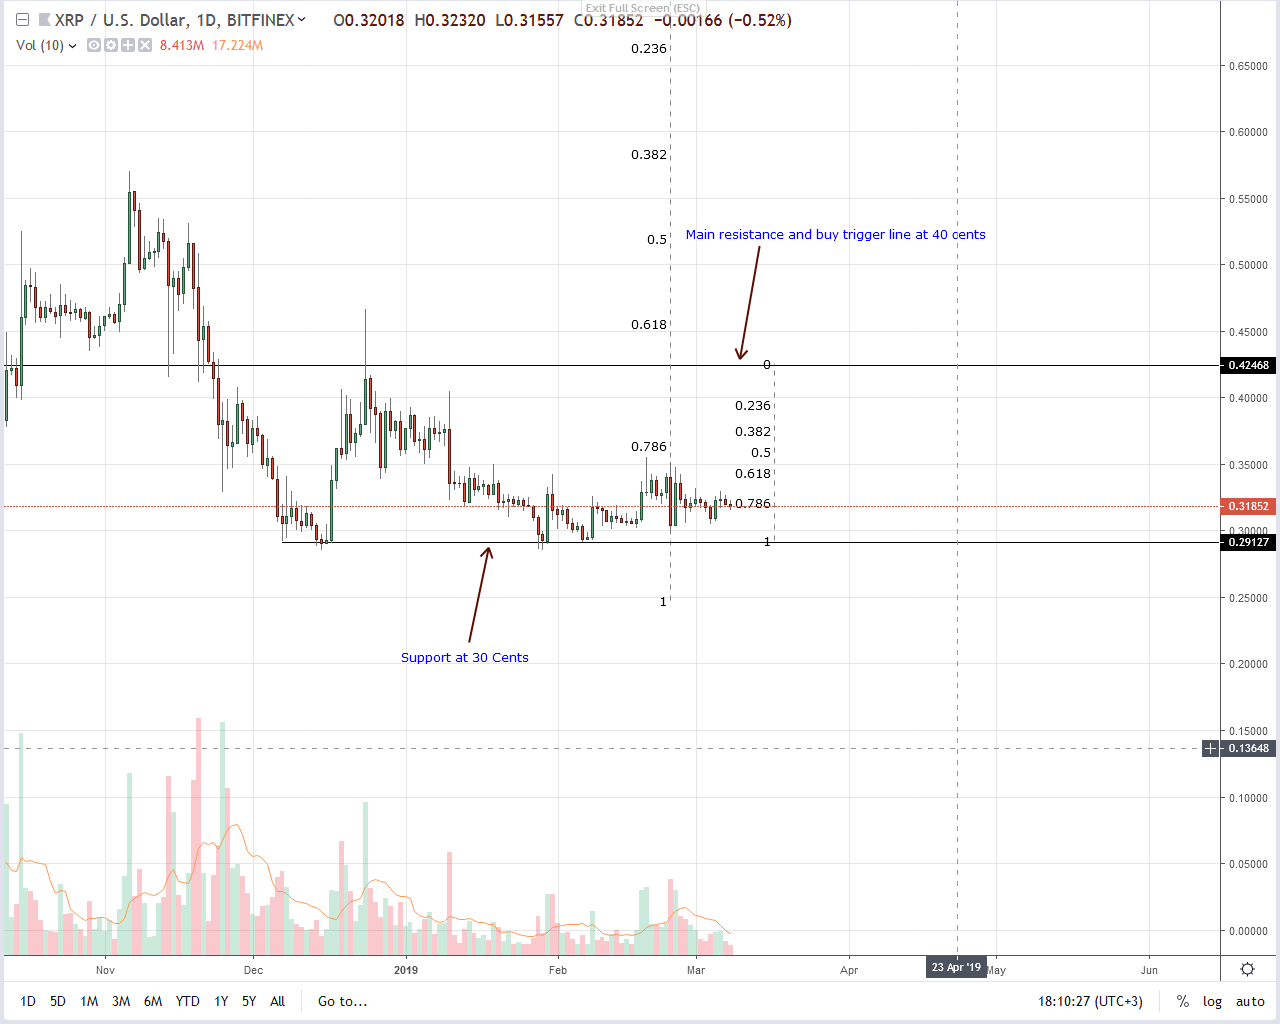
As long as there is doubt on XRP status, financial institutions, as well as processors, will steer clear. Until then, Ripple (XRP) prices will be in range mode trading within tight trade channels with caps at 34 cents.
Ripple Price Analysis
Fundamentals
By design, the Ripple network is in place to cater to the needs of the more than 15,000 individual banks. Their scope is broad but slowed down by institutions not ready to “experiment” on user funds. With less than 300 banks, conversion rates remain low. Further making the adoption path slippery are “challenging” questions about XRP, ledger’s native currency.
While we can only speculate and take Ripple’s executives word as they are, processors—event those connecting the platform for their cross-border fund transfer as —are adamant that until after US regulators come forward and clarify, they will keep off the xRapid, one of the three main Ripple Inc solution.
A considerable differentiator here is that it uses XRP to fulfill liquidity requirements and even with recent xCurrent 4.0 upgrade, none are willing to upgrade and opt for xRapid. However, the unwavering support of SBI Group in Kitao and listing at CoinBase could calm nerves, opening a channel for possible integration.
The inculcation of xRapid by the majority is without a doubt what Brad and other honchos aspire, their end game. Aside from boosting confidence and demand for XRP, Ripple Inc objectives of creating a network that is reliable, cheap and above all global will be closer.
Candlestick Arrangements

The initial CoinBase excitement is quickly fading and replacing that is dropping prices. Although we are bullish on Ripple (XRP), the failure of bulls to generate momentum, clearing the 35 cents and 40 cents mark is negative for the third most valuable coins.
Our supports are set clear at 30 cents. Therefore, with every lower low, accumulation and horizontal ranging market, the 25 cents mark—the lows of our bullish anchor bar, is exposed. From this arrangement, bulls could be resilient. However, any confirmation of Feb 24 bears will quickly fade Feb 25 gains, wiping out gains and even table turning once prices slide below 30 cents with above-average transactional volumes. For now, we shall take a wait and see approach with a bullish overview.
Technical Indicators
Buy triggers are at 34 cents, the 61.8 percent Fibonacci retracement level marking the tops of this trading range. Because our stand-out bar is that of Feb 24—61 million against 30 million, the only way to confirm demand is if prices close above 34 cents with high volumes—above 61 million as bulls of Jan 30 or late Sep 2018 pump prices towards 40 cents.


