- Ripple price rallied recently and broke many key resistances near $0.3080 against the US dollar.
- The price even settled above the $0.3100 resistance and the 100 hourly simple moving average.
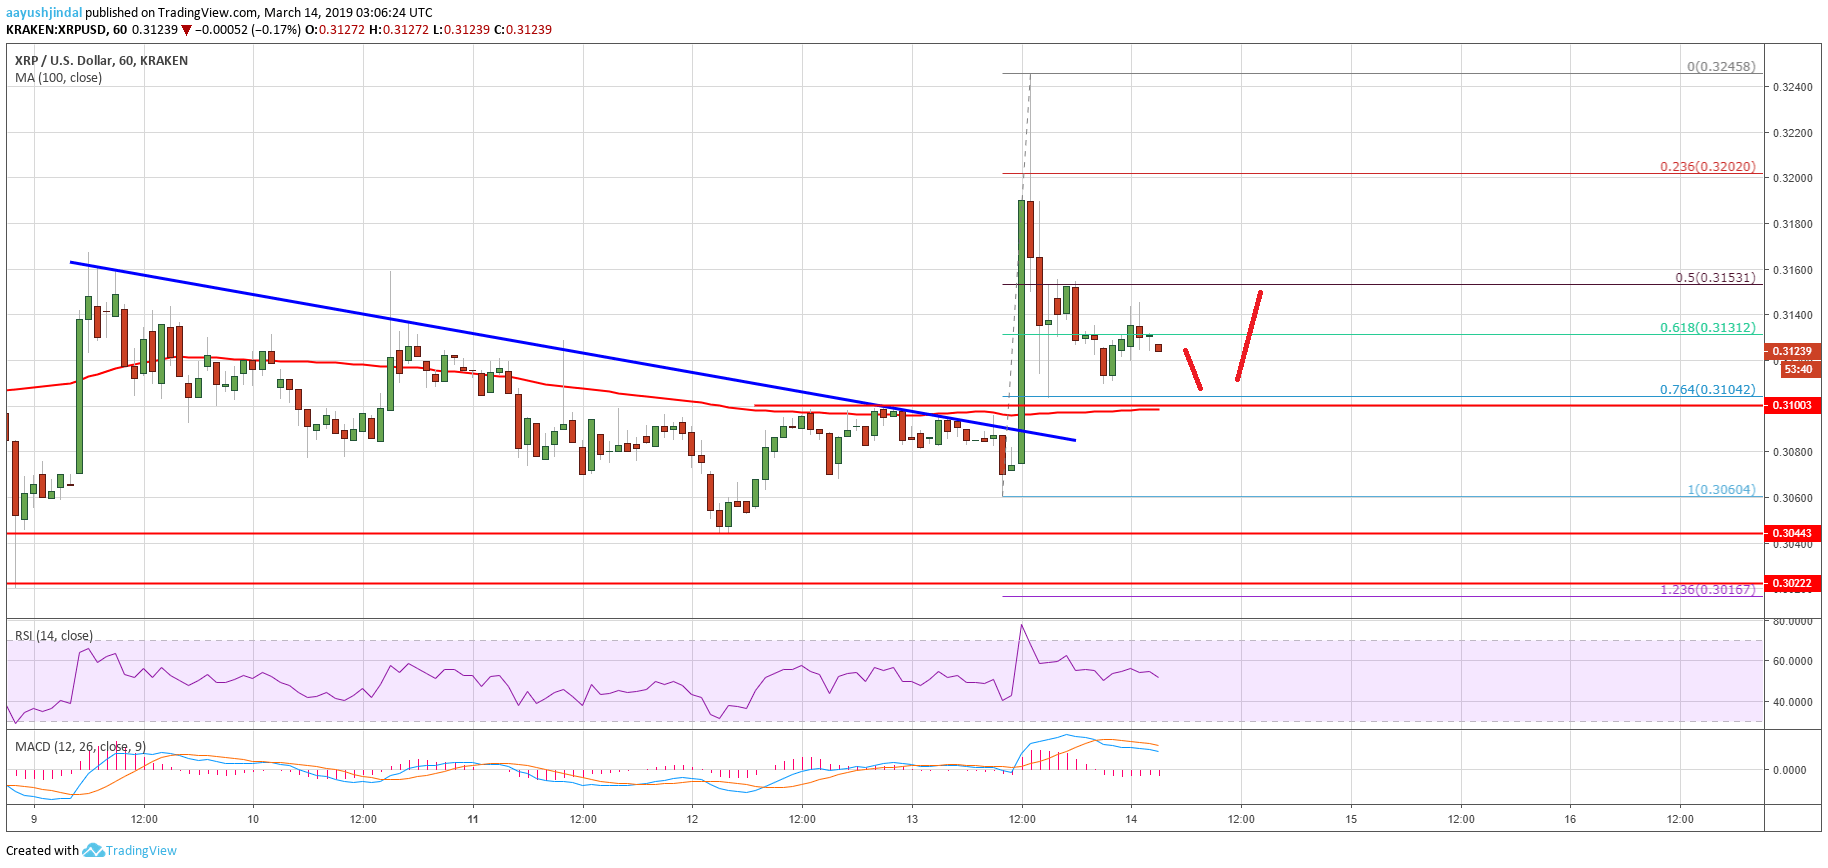
- Yesterday’s highlighted key bearish trend line was breached with resistance at $0.3085 on the hourly chart of the XRP/USD pair (data source from Kraken).
- The pair rallied towards the $0.3250 resistance level and later corrected lower sharply.
Ripple price moved nicely into a bullish zone against the US Dollar and bitcoin. XRP/USD is trading above the $0.3100 support and it could resume its upward move in the near term.
Ripple Price Analysis
Recently, we saw a steady decline in ripple price from the $0.3150 swing high against the US Dollar. The XRP/USD pair traded below the $0.3100 and $0.3080 support levels. However, the $0.3040 support area acted as a strong support. The price started a solid upward move and broke the $0.3060 and $0.3080 resistance levels to move into a positive zone. There was a break above the 61.8% Fib retracement level of the last decline from the $0.3135 high to $0.3045 low.More importantly, yesterday’s highlighted key bearish trend line was breached with resistance at $0.3085 on the hourly chart of the XRP/USD pair. It opened the doors for more gains and the price rallied above the $0.3100 resistance and the 100 hourly simple moving average. The upward move was strong as the price climbed above the $0.3150 and $0.3200 resistance levels. It traded towards the $0.3250 resistance level and later corrected lower sharply. It declined below the $0.3200 level and the 50% Fib retracement level of the recent rally from the $0.3060 low to $0.3245 high.