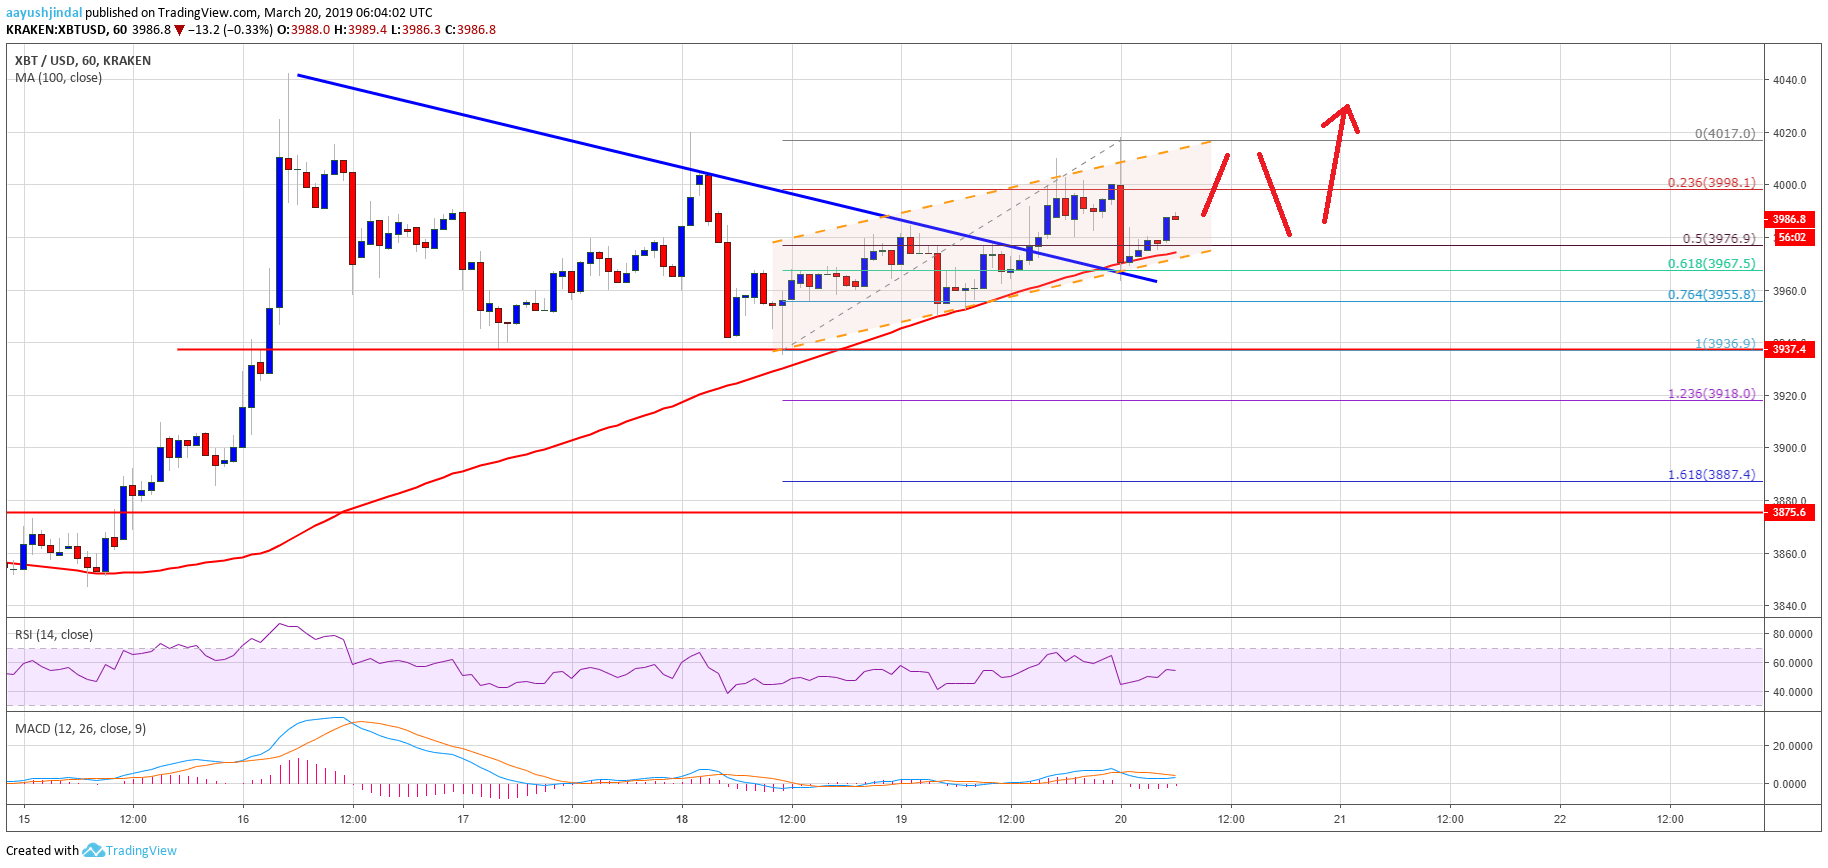
- Bitcoin price formed a strong support near the $3,940 level and climbed higher against the US Dollar.
- The price managed to clear the $3,965 and $3,980 resistance levels to move into a positive zone.
- Yesterday’s highlighted key bearish trend line was breached with resistance at $3,970 on the hourly chart of the BTC/USD pair (data feed from Kraken).
- The current price action is positive, but buyers need to gain strength above the $4,000 resistance.
Bitcoin price started a slow and steady rise against the US Dollar. BTC is showing positive signs and it seems like there could be an upside extension above the $4,000 and $4,040 levels.
Bitcoin Price Analysis
Recently, we saw a downside correction in bitcoin price below the $4,000 support against the US Dollar. The BTC/USD pair declined below the $3,980 and $3,960 levels. However, the $3,940 level acted as a strong support along with the 100 hourly simple moving average. Later, a solid support base was formed above $3,940 and the price slowly moved higher. It broke the $3,960 resistance and the 50% Fib retracement level of the last slide from the $4,041 high to $3,935 swing low.
More importantly, yesterday’s highlighted key bearish trend line was breached with resistance at $3,970 on the hourly chart of the BTC/USD pair. The pair climbed above the $3,980 level to move into a positive zone. It traded above the $4,000 level and formed a high at $4,017 before correcting lower. There was a push below the 50% Fib retracement level of the last wave from the $3,836 low to $4,014 high. However, the price seems to be following an ascending channel with support at $3,965.
Besides, the 61.8% Fib retracement level of the last wave from the $3,836 low to $4,014 high is also near $3,965. Finally, the 100 hourly SMA is also positioned near the $3,960 support area. Therefore, the price could climb higher as long as it is above $3,960. An initial resistance is at $4,020, above which the price may test the $4,040 resistance.

Looking at the , bitcoin price is slowly gaining bullish momentum above the $3,980 level. However, BTC buyers need to gain strength above $4,020 and $4,040 to sustain the recent trend. Conversely, if there is a downside break below $3,960, the price could decline towards the 3,940 support. Any further losses might call for a sharp dip towards the $3,875 support in the near term.
Technical indicators:
Hourly MACD – The MACD is about to move into the bullish zone.
Hourly RSI (Relative Strength Index) – The RSI for BTC/USD moved above the 50 level and it is moving higher towards 60.
Major Support Levels – $3,960 followed by $3,940.
Major Resistance Levels – $4,000, $4,020 and $4,040.


