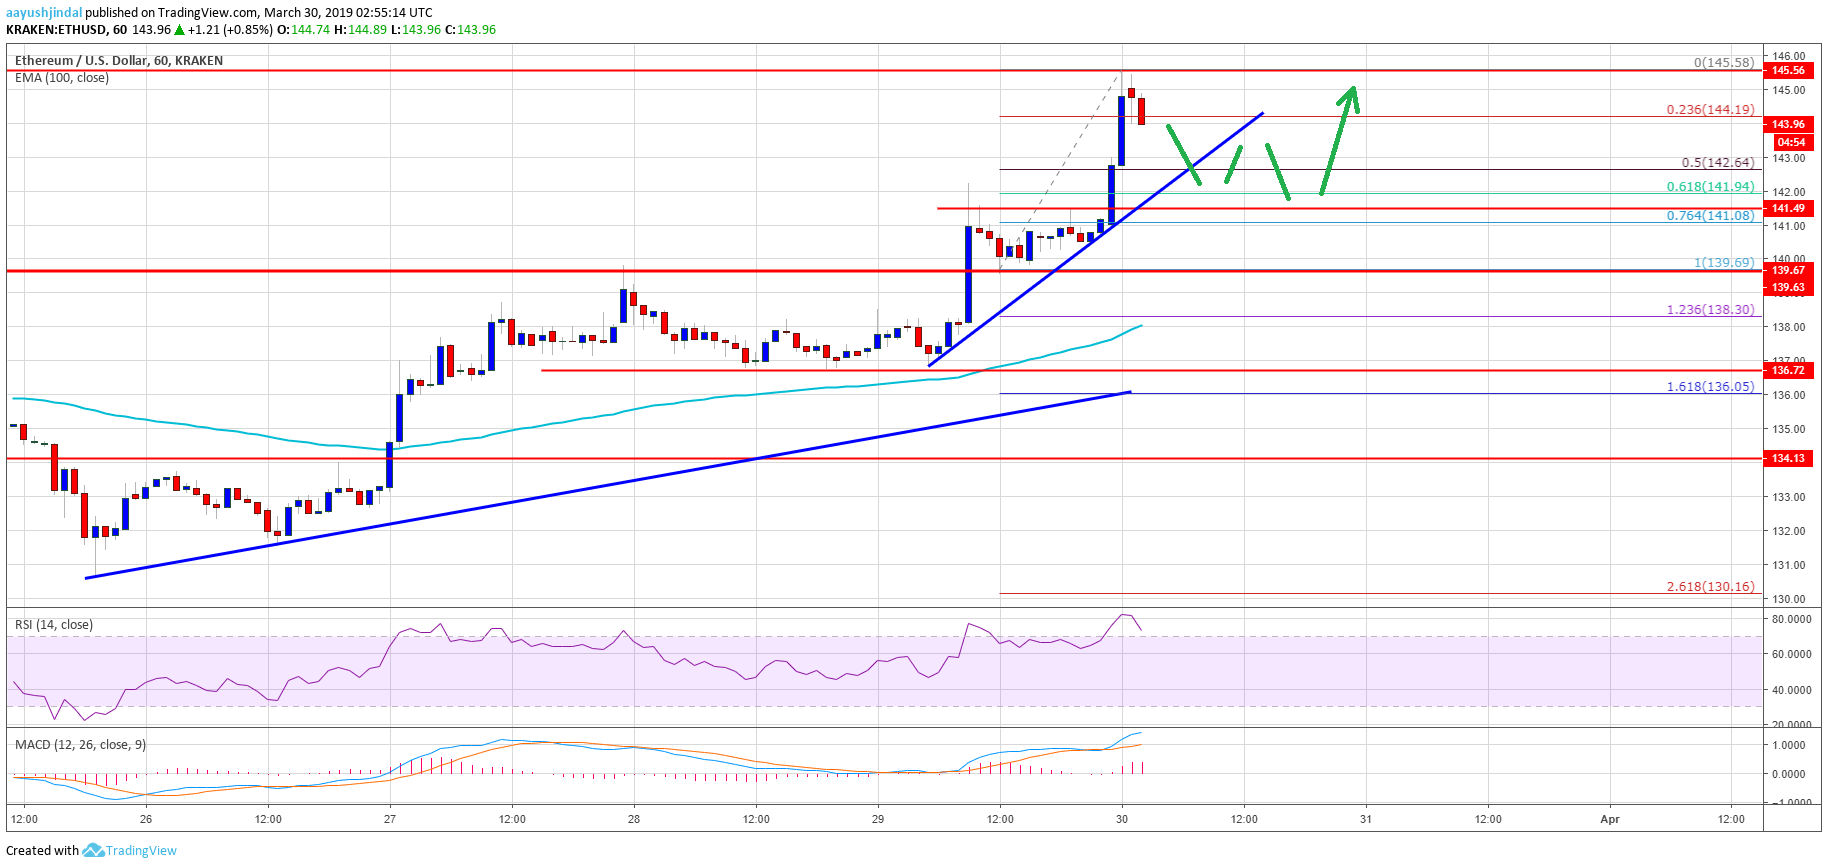
- ETH price extended upsides and gained bullish momentum above the $140 resistance against the US Dollar.
- The price even broke the $144 level and traded close to the $146 level before correcting lower.
- There is a key connecting bullish trend line formed with support above $143 on the hourly chart of ETH/USD (data feed via Kraken).
- There could be a downside correction, but the $141-142 support area is likely to act as a strong support.
Ethereum price is moving nicely in a positive trend against the US Dollar and bitcoin. ETH remains supported on dips and it seems like bulls are aiming for the $150 level.
Ethereum Price Analysis
Yesterday, we discussed about possible more gains above the $140 resistance in ETH price against the US Dollar. The ETH/USD pair dipped a few points, but it found a solid support near the $137 level. Later, there was a fresh increase and the price rallied above the $142 and $144 resistance level. The price even broke the $144 level and spiked above the $145 resistance. A new swing high was formed close to the $146 level and the price is currently correcting lower.At the outset, the price is trading well above the $140 support and the 100 hourly simple moving average. It is currently trading near the 23.6% Fib retracement level of the recent wave from the $140 swing low to $146 swing high. There is also a key connecting bullish trend line formed with support above $143 on the hourly chart of ETH/USD. It seems like the price may correct below the trend line and $142 in the short term. However, the $141 level may act as a strong support area.

ETH Technical Indicators
Hourly MACD – The MACD for ETH/USD is placed nicely in the bullish zone.
Hourly RSI – The RSI for ETH/USD is currently correcting lower from the 80 level.
Major Support Level – $141


