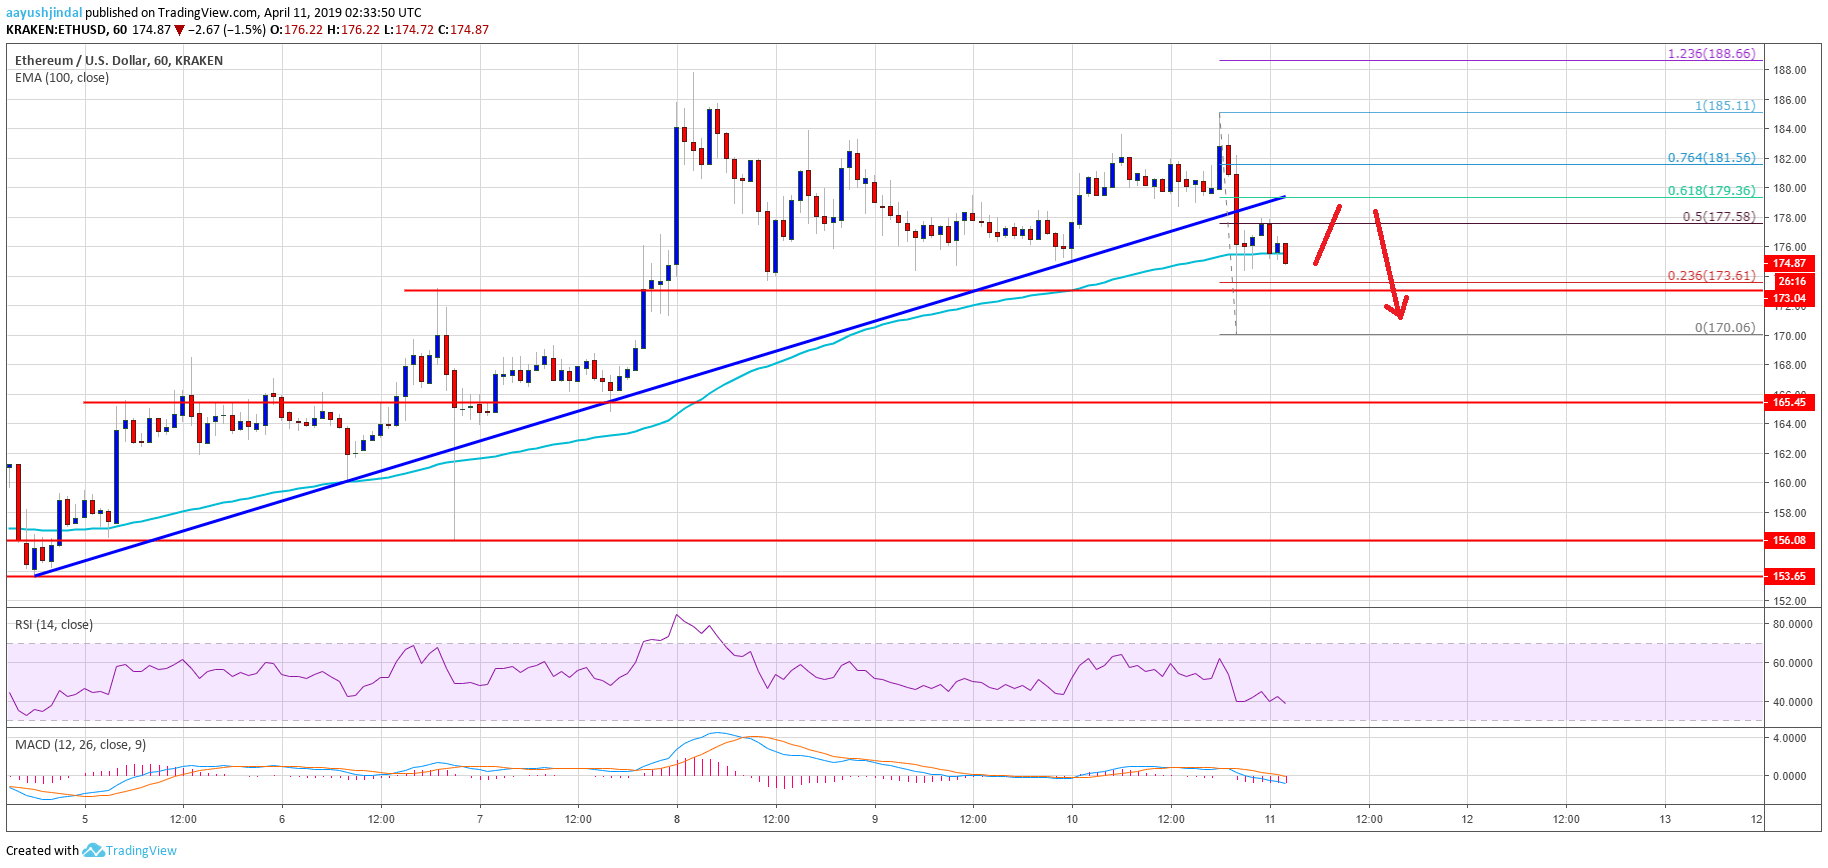
- ETH price extended gains, but it failed to overcome sellers near the $185 resistance against the US Dollar.
- The price started a downside correction and traded below the $180 and $174 supports.
- This week’s key bullish trend line was breached with support at $178 on the hourly chart of ETH/USD (data feed via Kraken).
- The pair remains at a risk of more losses, but it is likely to find a strong support above $165.
Ethereum price started a downside correction versus the US Dollar and bitcoin. ETH might extend the recent correction, but bulls are likely to defend losses near the $165 support.
Ethereum Price Analysis
Yesterday, we discussed the chances of more gains above $180 in Ethereum price against the US Dollar. The ETH/USD pair did move higher and traded above the $180 and $182 resistance levels. There was a sharp upward move, but the price failed to break the $185 resistance area. There was a rejection pattern formed near the 61.8% Fib retracement level of the last slide from the $188 swing high to $174 low. As a result, the price started a sharp downside correction below the $182 and $180 levels.
More importantly, this key bullish trend line was breached with support at $178 on the hourly chart of ETH/USD. The pair even spiked below the $174 support level and formed a new intraday low at $170.06. Recently, it recovered a few points above $173 and the 23.6% Fib retracement level of the recent drop from the $185 high to $170 low. However, the price is facing a strong resistance near the broken trend line and $178.
ETH Technical Indicators
Hourly MACD – The MACD for ETH/USD is gaining momentum in the bearish zone.
Hourly RSI – The RSI for ETH/USD declined sharply below the 50 level and it is currently near 40.
Major Support Level – $170


