- Bitcoin price corrected lower recently and traded below $5,500 and $5,480 against the US Dollar.
- The price traded close to the $5,370 level and it is currently trading with a bearish bias.
- There is a key bullish trend line formed with support at $5,405 on the hourly chart of the BTC/USD pair (data feed from Kraken).
- The pair could extend losses towards the $5,340 support before it could bounce back.
Bitcoin price started a major downside correction below $5,450 against the US Dollar. BTC may test the key $5,340-5,350 support zone before it could start a fresh increase.
Bitcoin Price Analysis
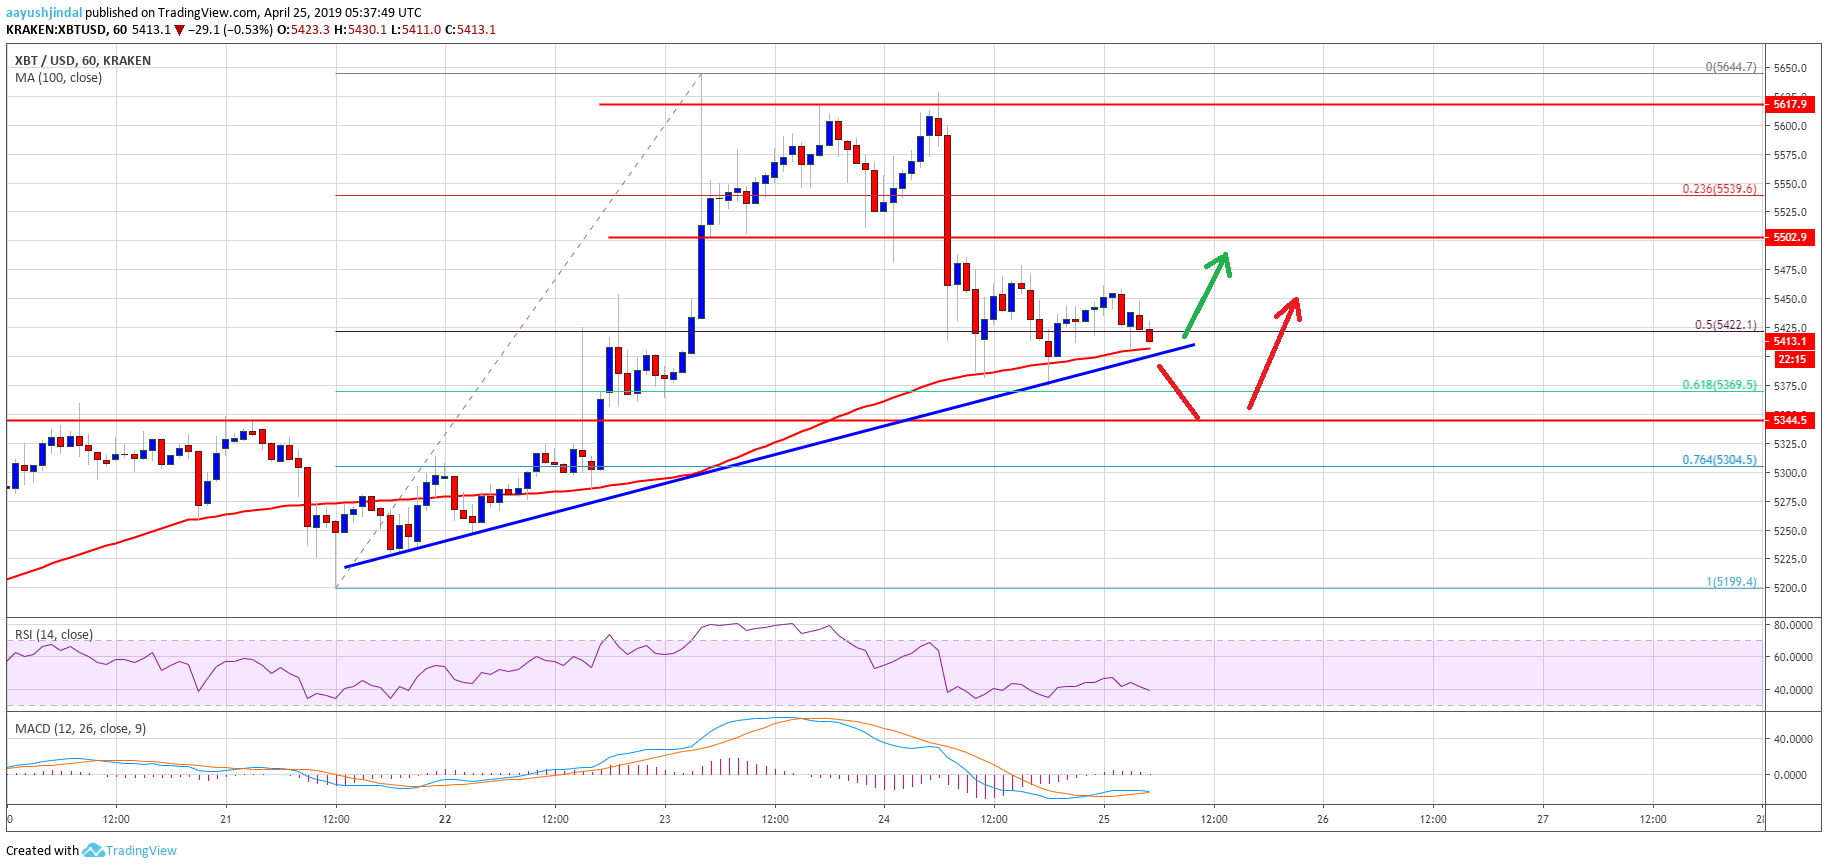
After a strong upward move, bitcoin price started a downside correction from the $5,640 swing high against the US Dollar. The BTC/USD pair traded below the $5,600 and $5,520 levels to move into a short term bearish zone. The pair even broke the $5,480 support and settled below the key $5,450 support level. Recently, there was a break below the 50% Fib retracement level of the last wave from the $5,199 low to $5,644 high.
The price spiked below the $5,400 support and traded close to the $5,370 level. Besides, the price traded close to the 61.8% Fib retracement level of the last wave from the $5,199 low to $5,644 high. At the moment, the price is consolidating above the $5,400 level and the 100 hourly simple moving average. There is also a key bullish trend line formed with support at $5,405 on the hourly chart of the BTC/USD pair. Clearly, the price is trading near a strong support at $5,400. If there is a downside break below $5,400 and the 100 hourly SMA, the price could extend losses.
The next key support area is near $5,350-5,340 (the previous major resistance). The bulls are likely to defend the $5,340 support area in the near term. On the upside, the price must break the $5,450 resistance to start a decent rebound. However, the main resistance is at $5,500, above which the price could move back towards the $5,640 level.

Looking at the , bitcoin price seems to be extending its decline towards the $5,350 level. However, it won’t be easy for sellers to clear the $5,340-5,350 support area. Once the current correction is complete, the price is likely to bounce back in the near term. Further below $5,340, the price might move into a bearish zone towards the $5,000 handle.
Technical indicators:
Hourly MACD – The MACD is struggling to gain pace in the bullish zone.
Hourly RSI (Relative Strength Index) – The RSI for BTC/USD is now well below the 50 level and it could slide towards 35 or 30.
Major Support Levels – $5,400 followed by $5,340.
Major Resistance Levels – $5,450, $5,500 and $5,540.


