- ETH price started a fresh decline after tagging the key $180 resistance level against the US Dollar.
- The price broke the $175 and $169 support levels to test the next support near $164.
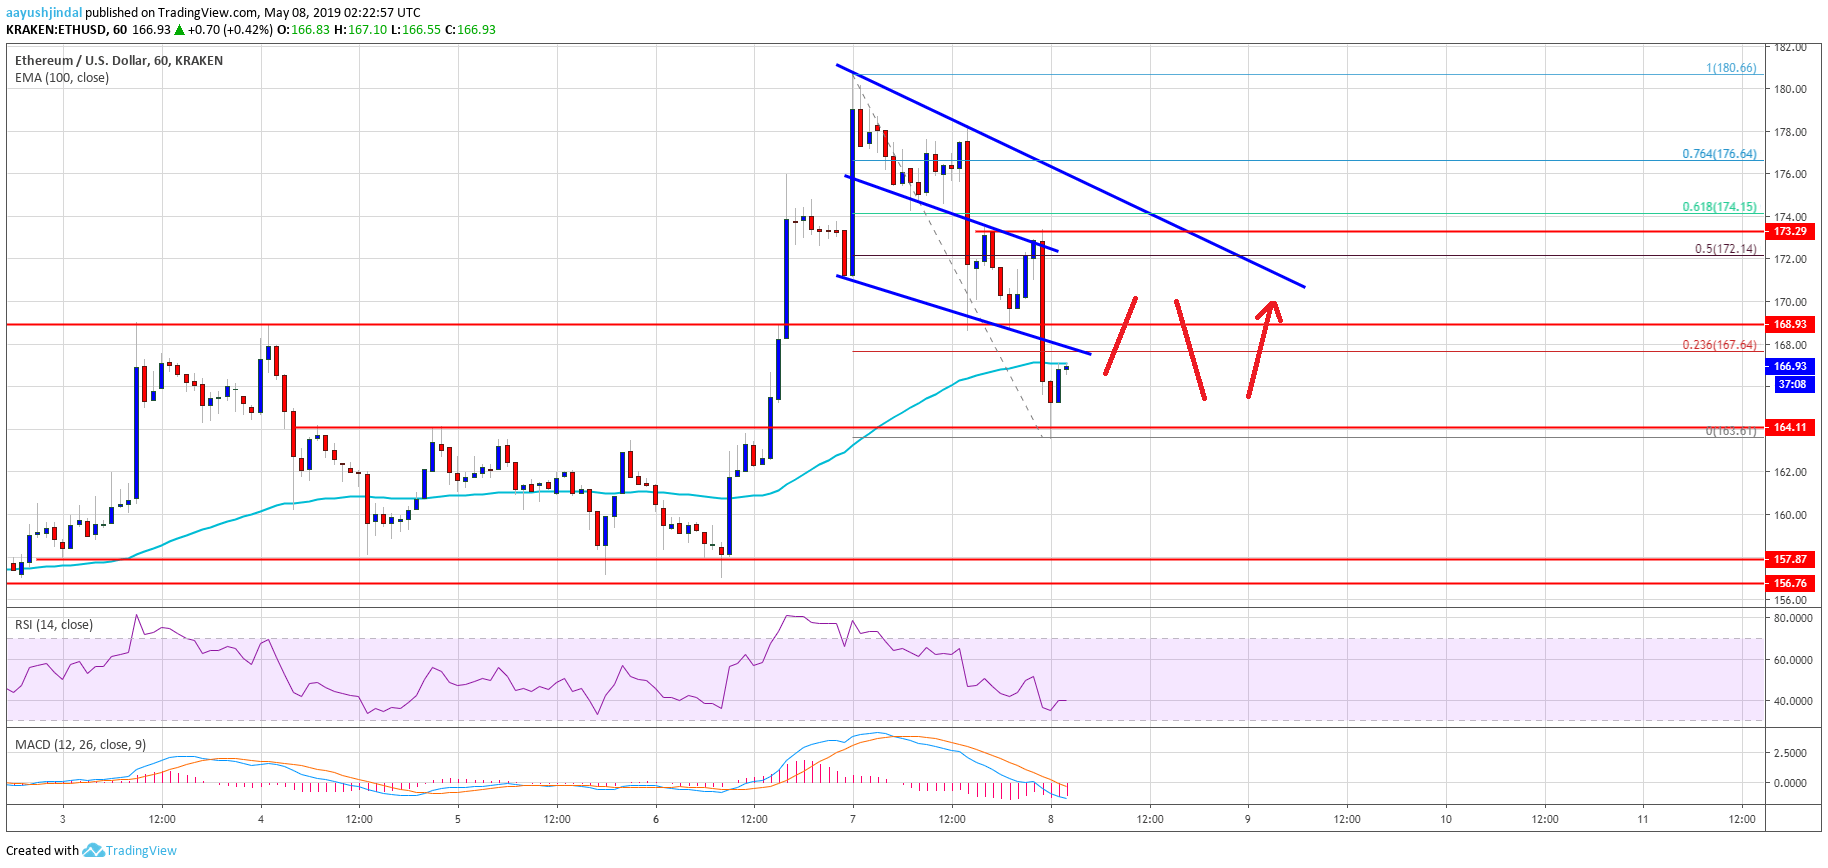
- There is a short term connecting bearish trend line in place with resistance at $172 on the hourly chart of ETH/USD (data feed via Kraken).
- The pair could consolidate for a few hours before it could test the $172 and $174 resistance levels.
Ethereum price trimmed most its recent gains versus the US Dollar and bitcoin. ETH tested the $164 support and it may soon bounce back above $170 in the coming sessions.
Ethereum Price Analysis
Yesterday, Ethereum price climbed above the key $170 and $175 resistance levels against the US Dollar. The ETH/USD pair even broke the $178 level and settled above the 100 hourly simple moving average. It tested the $180 resistance zone, where sellers appeared. Later, there was a downward move below the $175 support level. The decline gathered pace after the report of 7,000 BTC hack from the cryptocurrency exchange, binance. It fueled the downside and pushed the price below $169 and the 100 hourly SMA.
The price even broke the 61.8% Fib retracement level of the upward move from the $160 low to $180 high. Finally, the price found support near the $164 level and it is currently consolidating losses. An immediate resistance is near the $168 level and the 100 hourly SMA. Besides, the 23.6% Fib retracement level of the recent drop from the $180 high to $164 low is also near the $168 level. Above $168, there are many hurdles near the $170 and $172 levels.

ETH Technical Indicators
Hourly MACD – The MACD for ETH/USD moved back in the bearish zone, with a negative bias.
Hourly RSI – The RSI for ETH/USD declined steadily below the 50 level and it is currently near the 40 level.
Major Support Level – $164


