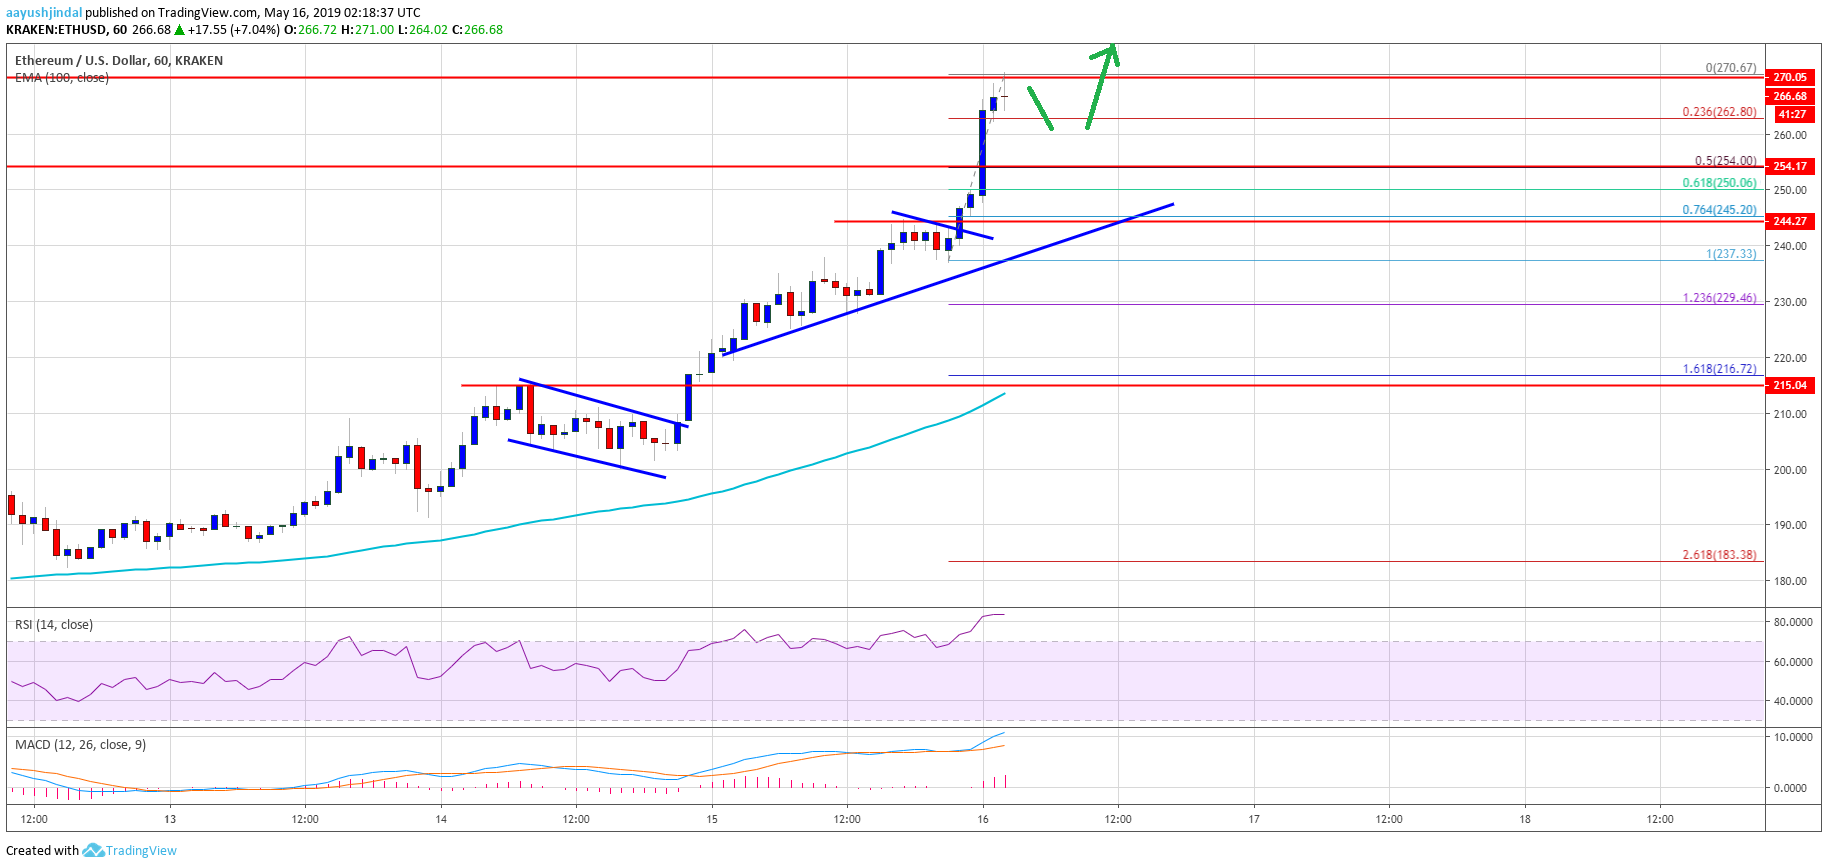
- ETH price surged higher and broke the key $240 and $250 resistance levels against the US Dollar.
- The price is up more than 20% and it recently tested the $270 resistance level.
- There is a new key bullish trend line forming with support near $244 on the hourly chart of ETH/USD (data feed via Kraken).
- The pair is following a strong uptrend and it seems like the price could even surge towards $300.
Ethereum price surged significantly towards $270 versus the US Dollar, and jumped sharply vs bitcoin. ETH is in a major bull run and it seems like the price might even hit $300.
Ethereum Price Analysis
Yesterday, we saw a sharp increase in Ethereum price above $220 resistance against the US Dollar. The ETH/USD pair gained pace above the $225 resistance and rallied above the second target discussed this week. It broke the key $240 and $250 resistance levels to move further into a positive zone. The uptrend was such that the price gained more than 20% and even tested the $270 level. The price is currently well above the $260 level and placed nicely above the 100 hourly simple moving average.
A swing high is formed at $270 and the price is still showing a lot of positive signs. If there is a downside correction, an immediate support is at $262. It represents the 23.6% Fib retracement level of the recent surge from the $237 swing low to $270 high. If there is an extended downside correction, the price could test the $254 support level. The 50% Fib retracement level of the recent surge from the $237 swing low to $270 high is also near the $254 support. Besides, there is a new key bullish trend line forming with support near $244 on the hourly chart of ETH/USD.

ETH Technical Indicators
Hourly MACD – The MACD for ETH/USD is currently placed heavily in the bullish zone.
Hourly RSI – The RSI for ETH/USD is now in the overbought zone, with no major correction signal.
Major Support Level – $254


