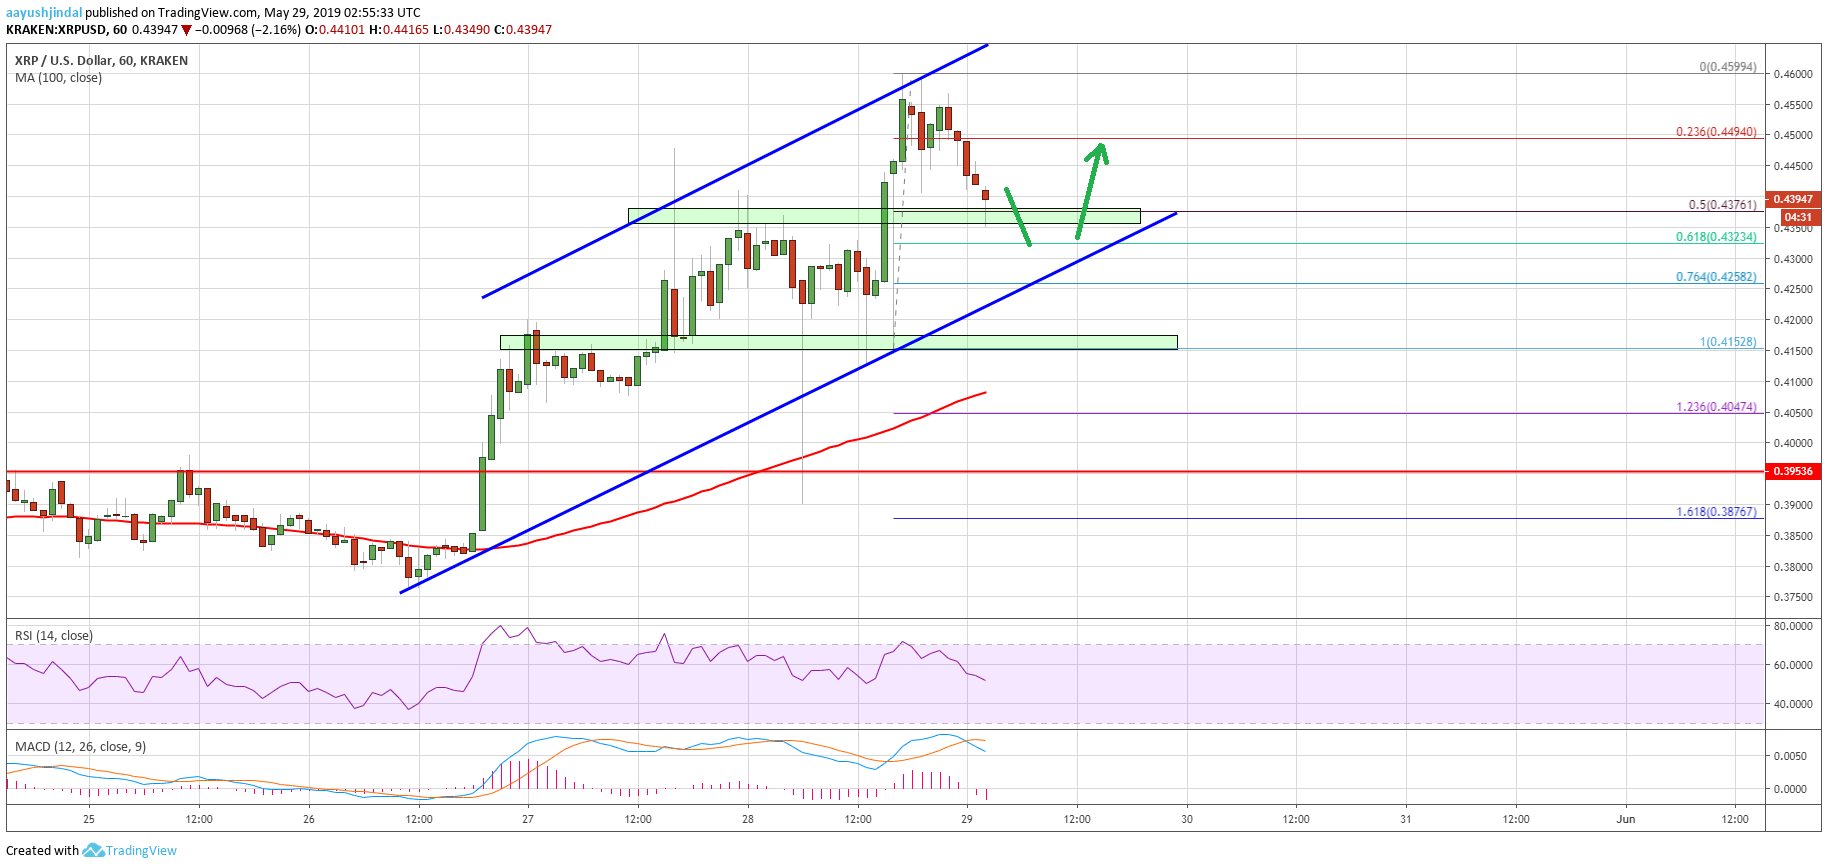
- Ripple price rallied recently above the $0.4240 and $0.4500 resistance levels against the US dollar.
- The price traded to a new weekly high at $0.4599 and it is currently correcting lower.
- There is a major bullish trend line forming with support at $0.4320 on the hourly chart of the XRP/USD pair (data source from Kraken).
- The pair is likely to bounce back as long as it is trading above the $0.4152 pivot level.
Ripple price is trading with a positive bias against the US Dollar and bitcoin. XRP is currently correcting from highs, but dips remain well supported above the $0.4200 level.
Ripple Price Analysis
In the past two days, there was a strong rise in ripple price above the $0.4200 resistance against the US Dollar. The XRP/USD pair broke many resistances recently, including $0.4250, $0.4350, $0.4420 and $0.4500. There was a close above the $0.4300 level and the 100 hourly simple moving average. The price traded towards the $0.4600 level and formed a new weekly high at $0.4599. Recently, it started a downside correction and traded below the $0.4550 and $0.4500 support levels.
Moreover, there was a break below the 23.6% Fib retracement level of the recent leg from the $0.4152 low to $0.4599 swing high. However, there are many supports on the downside near the $0.4360 and $0.4320 levels. The 50% Fib retracement level of the recent leg from the $0.4152 low to $0.4599 swing high is currently acting as a support near $0.4375. More importantly, there is a major bullish trend line forming with support at $0.4320 on the hourly chart of the XRP/USD pair.


