- Ripple price found support near the $0.2830 level and recovered recently against the US dollar.
- The price traded above the $0.2940 resistance and the $0.3000 pivot level.
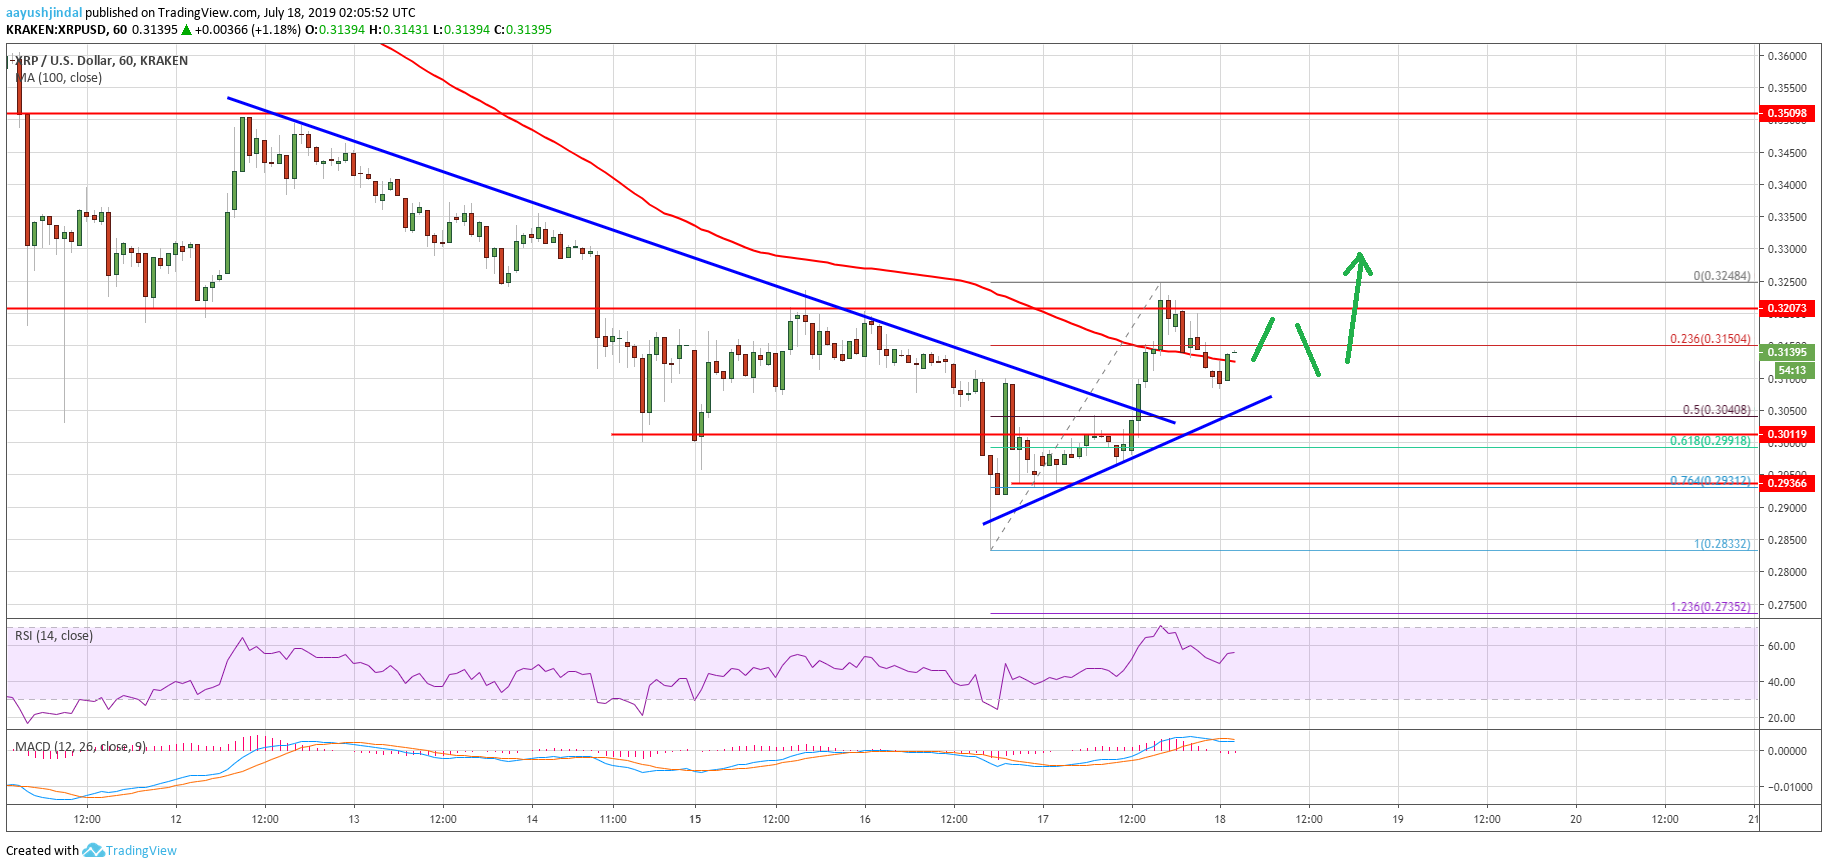
- This week’s followed bearish trend line was breached with resistance near $0.3040 on the hourly chart of the XRP/USD pair (data source from Kraken).
- The price is now trading with a few positive signs above the $0.3050 support area.
Ripple price is currently trading with a bullish angle against the US Dollar and bitcoin. XRP price could extend its recovery if there is an upside break above the $0.3230 resistance area.
Ripple Price Analysis
Yesterday, we saw a strong drop in bitcoin and Ethereum, but dips were limited in ripple price against the US Dollar. The XRP/USD pair broke the $0.2940 support level and traded to a new monthly low. A swing low was formed near $0.2833 and recently the price started an upside correction. There was a break above the $0.2940 and $0.3000 resistance levels to start a recovery.
Moreover, this week’s followed bearish trend line was breached with resistance near $0.3040 on the hourly chart of the XRP/USD pair. It opened the doors for more gains above the $0.3150 resistance. However, the upward move is facing hurdles near the $0.0.3230 and $0.3240 resistance levels. As a result, the price corrected gains below $0.3150 and the 100 hourly simple moving average. Besides, there was a break below the 23.6% Fib retracement level of the recent wave from the $0.2833 low to $0.3248 high.