
- ETH price is currently correcting higher and is trading above the $190 level against the US Dollar.
- The price is still trading well below the key $195 resistance area.
- There was a break above a major declining channel with resistance near $192 on the hourly chart of ETH/USD (data feed via Kraken).
- The pair is struggling to continue above $192 and $194, and it might decline again.
Ethereum price is facing a lot of selling interest versus the US Dollar and bitcoin. ETH remains at a risk of a fresh decline despite recent gains in BTC.
Ethereum Price Analysis
In the weekly forecast, as we a few important resistance for ETH price near the $192 and $195 levels against the US Dollar. The price formed a decent support near $182 recently and started an upside correction. The bulls gained traction above the $190 resistance level and the 100 hourly simple moving average. Moreover, bitcoin price jumped 5% recently and surged to test the $10,500 resistance level.
Ethereum price also climbed above the 50% Fib retracement level of the recent drop from the $197 high to $182 low. It opened the doors for more gains above the $192 level. Moreover, there was a break above a major declining channel with resistance near $192 on the hourly chart of ETH/USD. The pair tested the $194-195 resistance area, where the bulls struggled.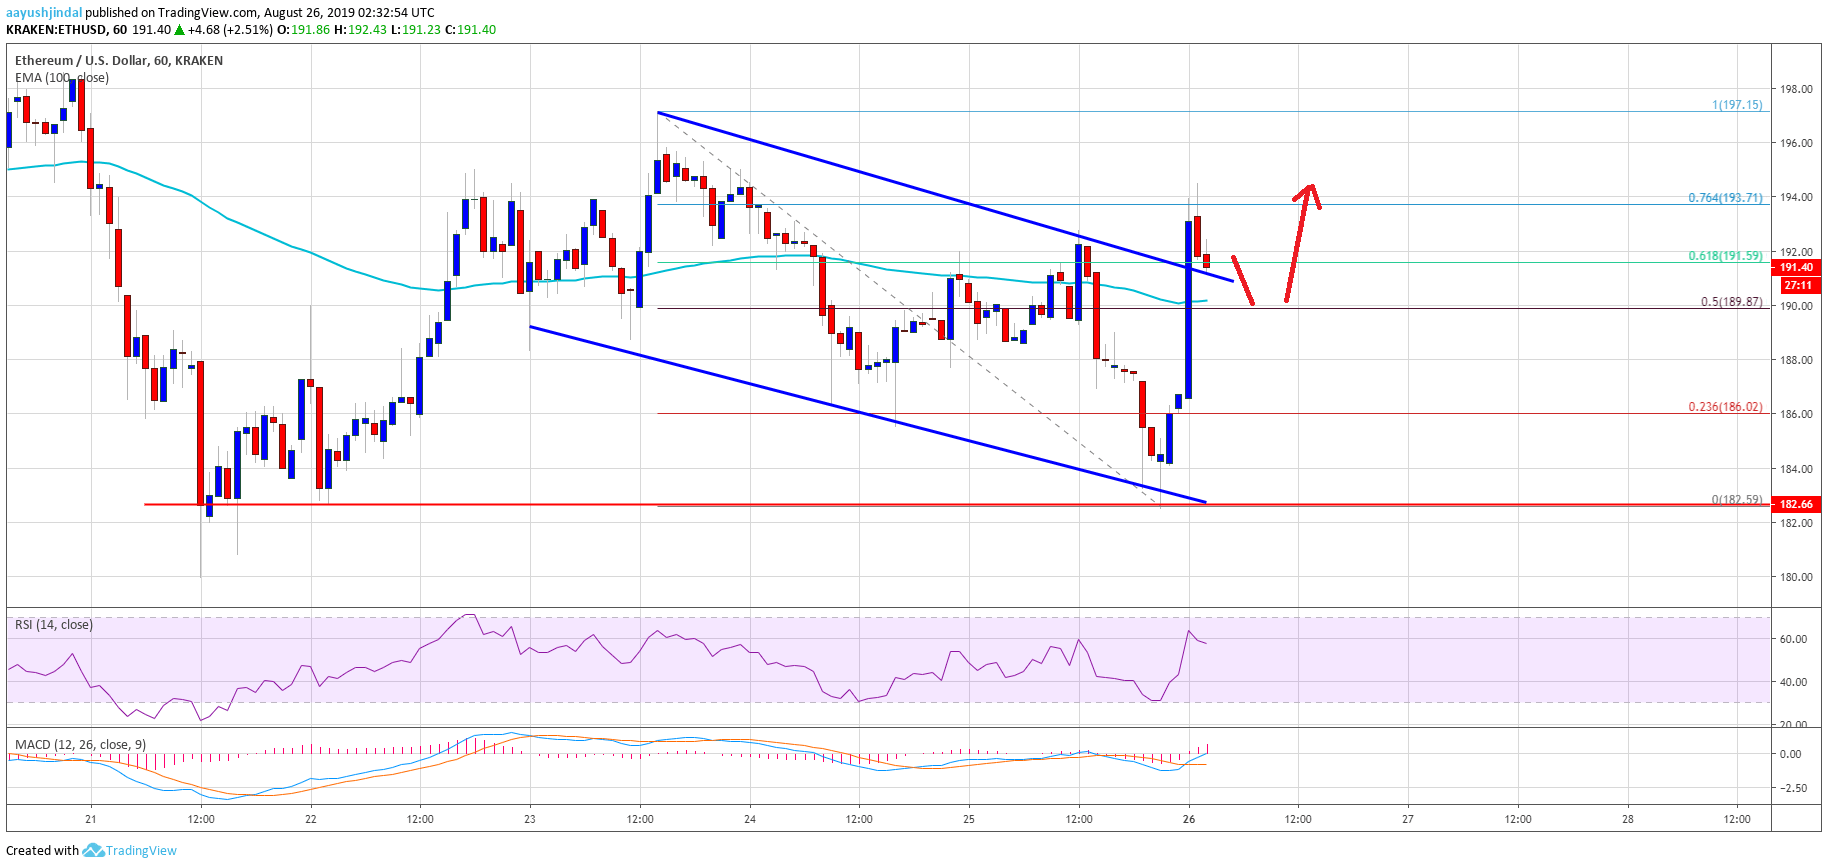
ETH Technical Indicators
Hourly MACD – The MACD for ETH/USD is gaining momentum in the bullish zone.
Hourly RSI – The RSI for ETH/USD is currently placed nicely above the 50 level.


