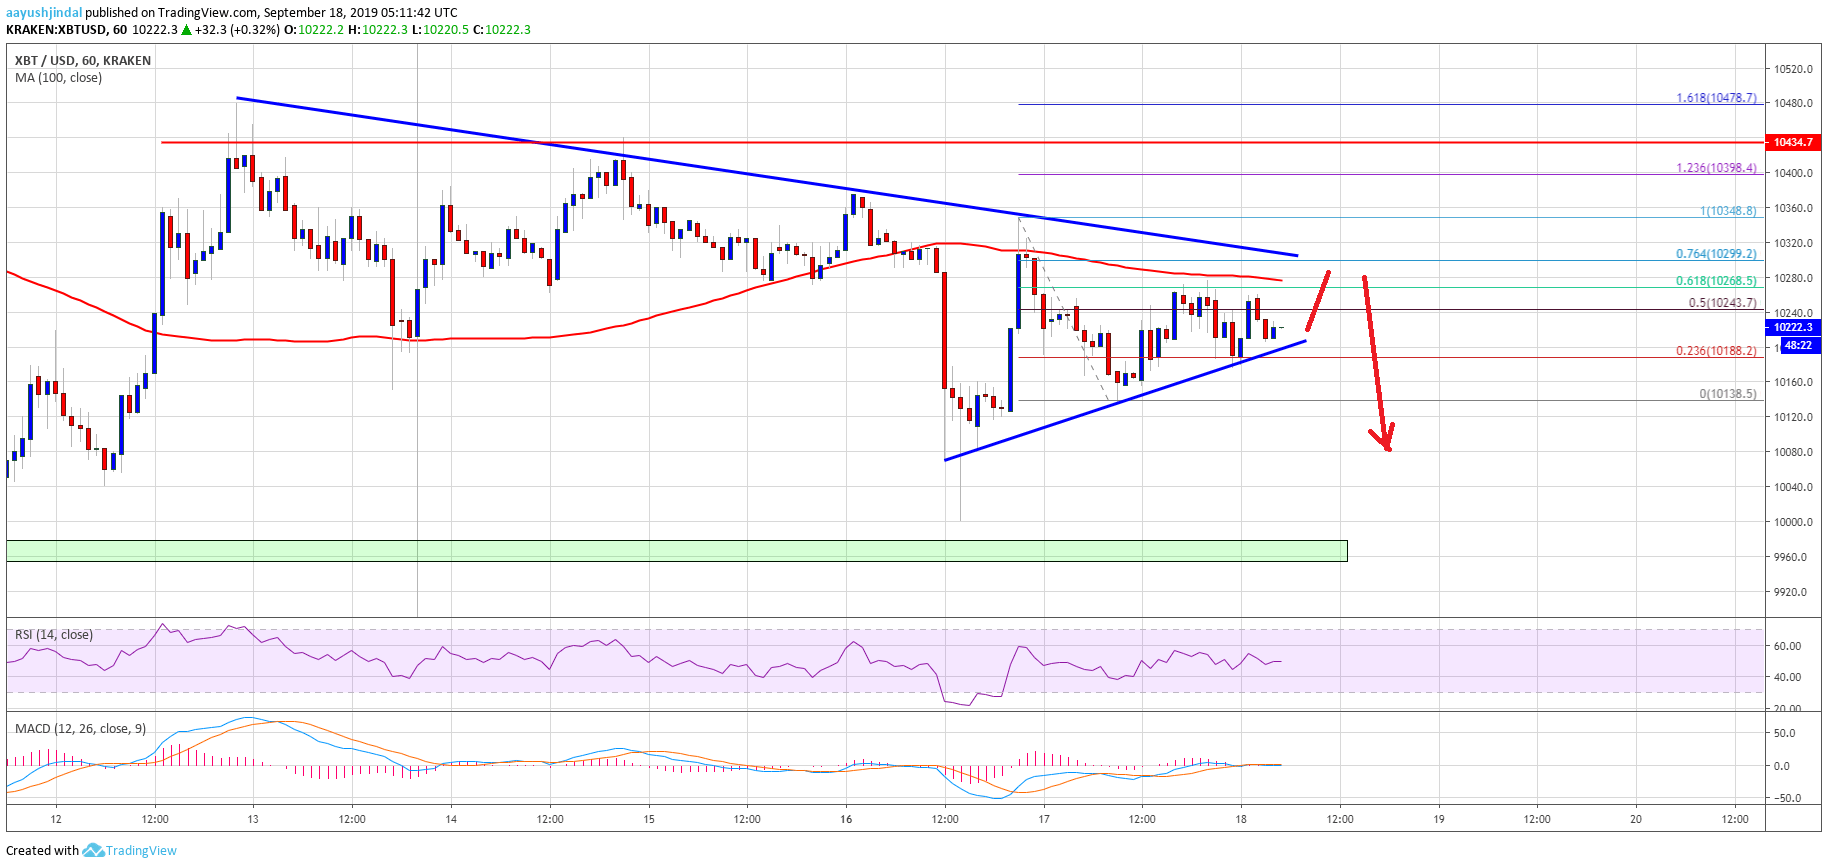
- Bitcoin price is trading in a range below the $10,300 and $10,400 resistances against the US Dollar.
- The price is struggling to gain momentum above $10,300 and the 100 hourly SMA.
- There is a key breakout pattern forming with support near $10,200 on the hourly chart of the BTC/USD pair (data feed from Kraken).
- The price could either rally above $10,400 or it might extend its decline towards the $9,900 support.
Bitcoin price is trading below key resistances and hurdles against the US Dollar. BTC is likely to make the next move either above $10,400 or towards $9,900.
Bitcoin Price Analysis
In the past three days, bitcoin price declined steadily below $10,400 against the US Dollar. On the other hand, Ethereum rallied above $200 and ripple price surged above the $0.3000 resistance. BTC/USD is now trading well below the $10,300 level and the 100 hourly simple moving average. The last swing high was formed near $10,348 and the recent low was near $10,138.
At the moment, the price is consolidating gains above $10,200. It broke the $10,240 resistance, plus the 50% Fib retracement level of the recent decline from the $10,348 high to $10,138 low. However, the upward move was capped by the $10,270 level. It seems like the 61.8% Fib retracement level of the recent decline from the $10,348 high to $10,138 low is capping the upward move.


