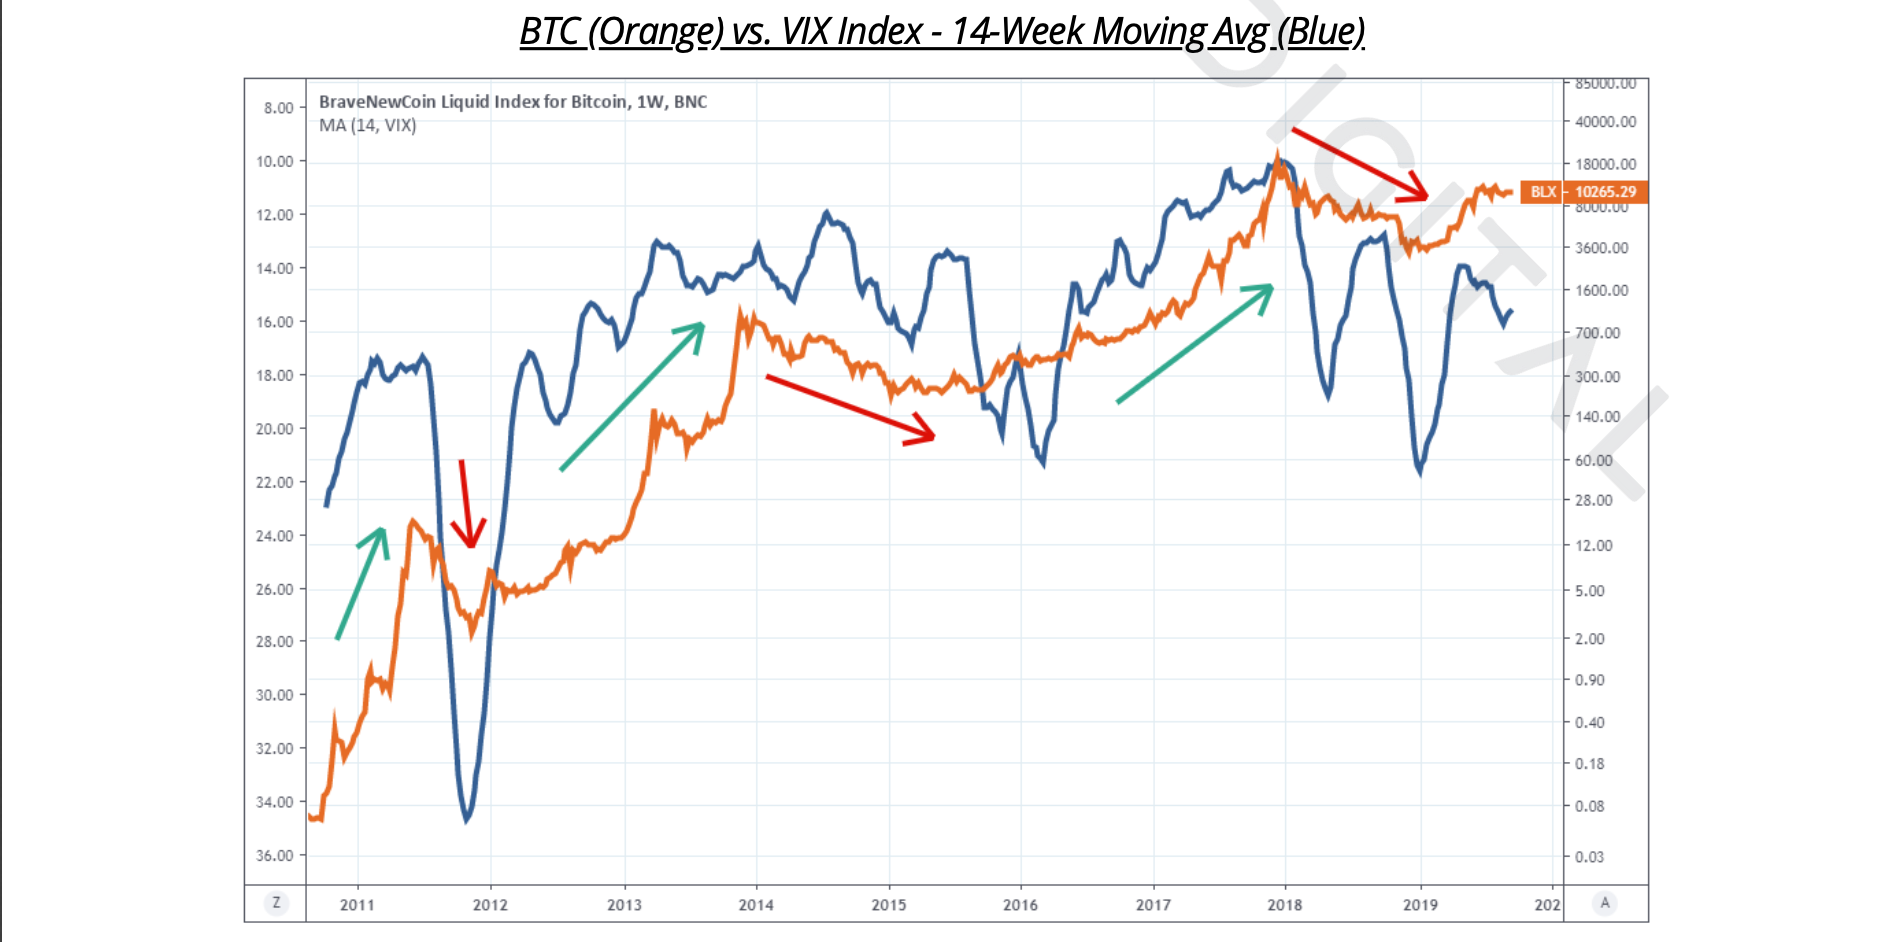
“The relationship is far from perfect, but we’ve seen multiple instances where a rise in market volatility corresponded with a pullback or sell-off in BTC,” wrote Kelly. “This is a significant trend to monitor since the end of cycles usually bring more considerable uncertainty and asset price volatility.”
“Investors should cross-reference the correlation data before making any trade decision,” the Malta firm reminded.
Irregularity
Low volatility in US equities tends to push traders and investors to assets showing a higher level of price swings. Kelly noted that in 2017, speculators started moving to bitcoin and other cryptocurrencies as US options became motionless. The analyst indicated that traders wanted to test bitcoin partially because it was a non-correlated and nascent asset at that time. And favorable media reports were projecting its technology – the blockchain – as revolutionary.“This was a key catalyst for many FX and derivatives traders getting interested in bitcoin and crypto in the first place,” wrote Kelly.
The VIX Index is now going lower as investors digest the prospects of a string of macroeconomic risk, including the ongoing US-China trade dispute, central bank rate cuts, and quantitative easing programs. Bitcoin, on the other hand, is consolidating sideways insider a broader triangle pattern. That shows the cryptocurrency is breaking its positive correlation with the VIX Index. OKEx notes:
“Many of the time that BTC and the VIX were in an inverse relationship back in 2018, and the way how they relate to each other has regularly been shifting. So, the ideal strategy would be using aggregated data, such as the combinations of other correlations and exchange/asset flow data, to achieve positive results.”


