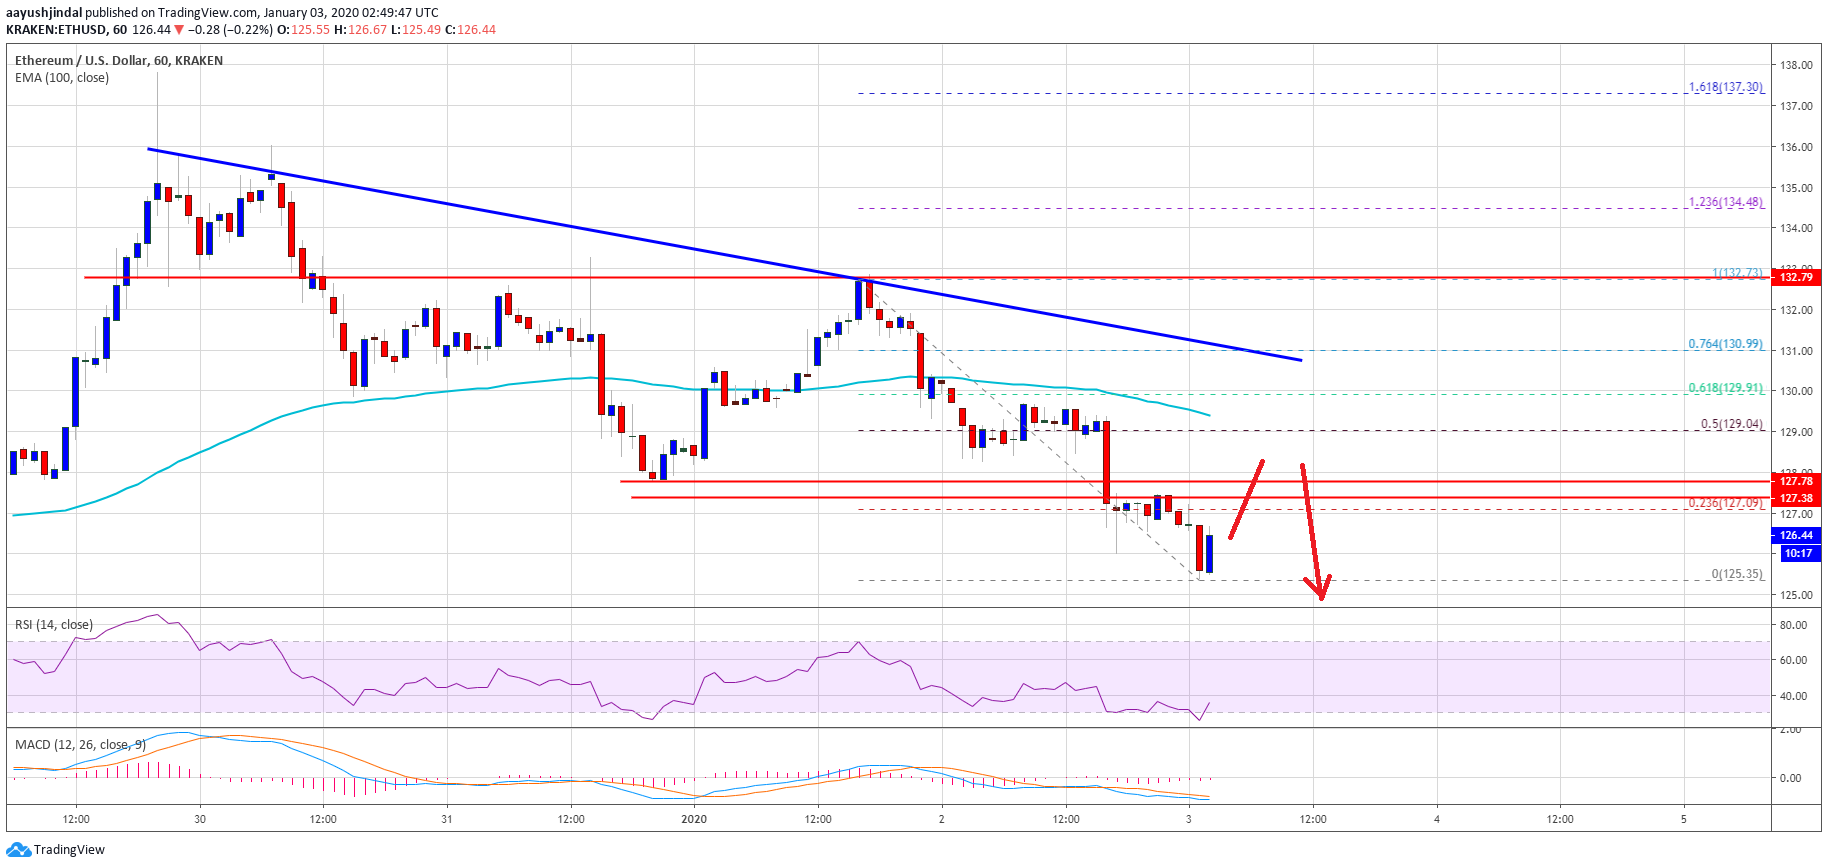
- Ethereum is down more than 2% and it is now well below $130 against the US Dollar.
- Bitcoin price weakened around 3% and it broke the key $7,000 support.
- Yesterday’s key bearish trend line is active with resistance near $131 on the hourly chart of ETH/USD (data feed via Kraken).
- ETH could continue to move down towards the $122 and $120 support levels in the near term.
Ethereum price is slowly moving lower below key supports versus the US Dollar, similar to bitcoin. ETH price might revisit $120 or even $115 before a decent upward move.
Ethereum Price Analysis
Yesterday, we saw an increase in selling on Ethereum below the $132 level against the US Dollar. Moreover, ETH price settled below the $130 level and the 100 hourly simple moving average.
The recent decline was such that the price declined below the $128 support level. Finally, it tested the $125 support and is currently consolidating losses. An initial resistance is near the $127 level.
Besides, the 23.6% Fib retracement level of the recent decline from the $133 high to $125 low is also near $127. More importantly, the previous support near $128 is likely to act as a resistance.
The next major resistance is near the $130 level and 100 hourly simple moving average. Additionally, the 50% Fib retracement level of the recent decline from the $133 high to $125 low is close to $128.
Above the 100 hourly SMA, yesterday’s key bearish trend line is active with resistance near $131 on the hourly chart of ETH/USD. Therefore, Ethereum price is clearly facing a lot of hurdles on the upside near the $128 and $130 levels.
The main resistance is now near the $132 level, above which the price is likely to start a strong rise towards the $138 and $140 levels.
Conversely, the price remains at a risk of more losses below the $125 support. The next support is near $122, followed by the $120 level. Any further losses may perhaps lead the price towards the $115 support area.

Looking at the , Ethereum price is showing a few bearish signs below $130 and $132. It seems like the price could spike towards the $120 or $115 level before it starts a decent upward move in the near term.
ETH Technical Indicators
Hourly MACD – The MACD for ETH/USD is likely to move into the bullish zone.
Hourly RSI – The RSI for ETH/USD is currently recovering towards the 40 level.
Major Support Level – $125
Major Resistance Level – $130


