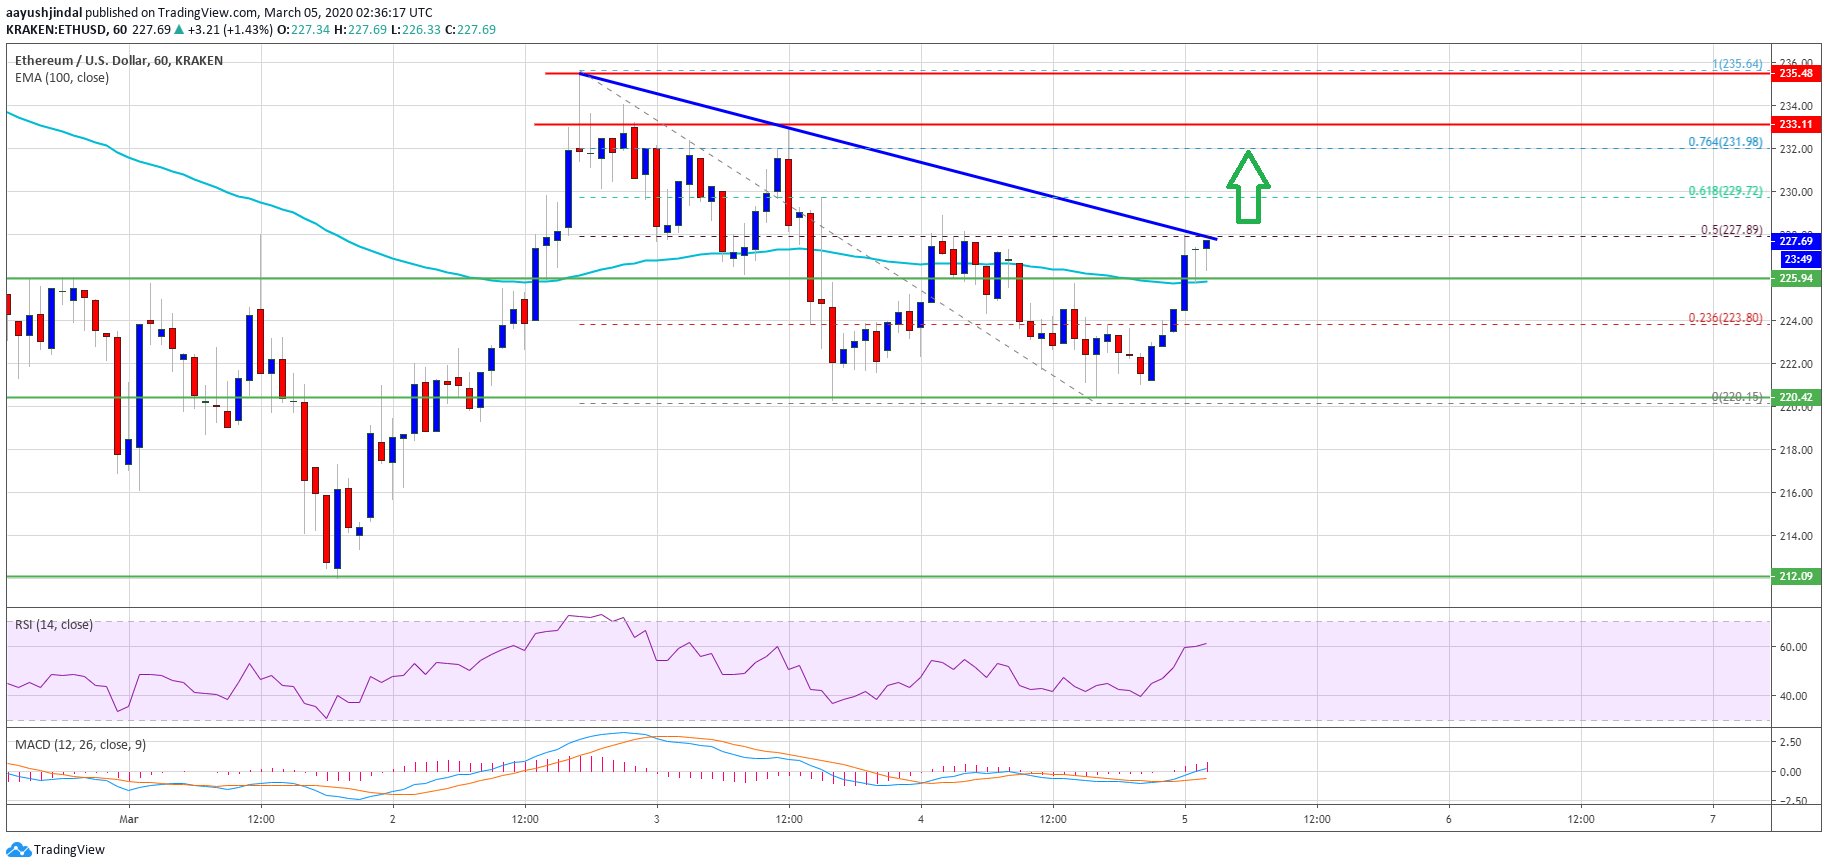
Ethereum is consolidating above the $220 support area against the US Dollar. ETH price is likely start a major upward move above the $228 and $235 resistance levels.
- Ethereum is forming a nice bullish formation above the $220 support area against the US Dollar.
- The price is likely to start a major rally once it settles above $228 and $230.
- There is a key bearish trend line forming with resistance near $228 on the hourly chart of ETH/USD (data feed via Kraken).
- Bitcoin price is likely setting up for a major upside break above the $9,000 resistance level.
Ethereum Price Could Surge Above $235
Yesterday, we saw a downside correction in Ethereum from the $235 resistance area against the US Dollar. ETH price broke a couple of key supports near $225 and the 100 hourly simple moving average.
However, the $220 support area acted as a strong buy zone. The price formed a crucial base above the $220 level and recently started a fresh increase. It is up around 1% and trading above the 23.6% Fib retracement level of the recent decline from the $235 high to $220 low.
On the upside, an initial resistance for Ethereum is near the $228 level. There is also a key bearish trend line forming with resistance near $228 on the hourly of ETH/USD.

The 50% Fib retracement level of the recent decline from the $235 high to $220 low is also near the $228 level and it is currently protecting gains. Therefore, a successful break above the $228 resistance could open the doors for a key bullish break.
The next key resistance is near the $235 level. Any further gains could lead the price towards the $250 and $255 resistance levels.
More Range Moves?
If Ethereum fails to climb above the $228 resistance area, it could decline again. An initial support is near the $225 level and the 100 hourly simple moving average.
If there is a downside break below the 100 hourly simple moving average, the price may perhaps slide back towards the $220 support level. The bulls are likely to defend the $220 support level, but if they fail, there is a risk of a strong decline towards the $210 level in the near term.
Technical Indicators
Hourly MACD – The MACD for ETH/USD is now gaining momentum in the bullish zone.
Hourly RSI – The RSI for ETH/USD is now well above the 50 level, with positive signs.
Major Support Level – $220
Major Resistance Level – $235


