It’s clear that Bitcoin is building towards a breakout. The cryptocurrency has converged towards supports in low-$9,000s, with volatility reaching multi-week and multi-month lows.
Unfortunately for bulls, a textbook chart pattern is predicting that Bitcoin will break lower from this range, likely to fall towards the $8,000s.
Related Reading: BTC Hash Rate Recovers to Pre-Halving Levels, But a Chinese Mine Just Burned Down
Bitcoin Wyckoff Distribution Analysis Predicts Drop to $8,000s
Richard Wyckoff is a late technical analyst that pioneered multiple forms of analysis. He is arguably best known for his Wyckoff schematics, which are patterns he noticed in the prices of assets that mark bottoms and tops of a trend.
According to one trader, Bitcoin is currently trading in a textbook Wyckoff Distribution pattern, which is suggestive of a trend topping out. The schematic is almost complete, save for a correction towards the low-$8,000s and maybe even lower that will complete it,
Bitcoin price chart with Wyckoff Distribution overlay shared by trader NebraskanGooner (@NebraskanGooner on Twitter). Chart from
The trader who shared the chart above isn’t the first to have suggested Bitcoin’s recent consolidation is a textbook Wyckoff Distribution.
Referencing Bitcoin’s failed attempt at breaking past $10,500 at the start of June, one trader said the following on BTC’s distributive properties:
“Volume-wise I can’t look past distribution up here given the reaction to the high sweep. There are very few re-accumulation ranges that we would expect to see that contain a move above the range which was so strongly rejected. Typically in a re-accumulation structure this move would hold, not come back inside. That’s usually one of our first signs of distribution.”
Notably, not all analysts using Wyckoff Distribution analyses agree on where Bitcoin’s distribution will end. Some have postulated the low-$8,000s (as laid out in the chart above) while others have suggested a drop to the $7,000s and even lower.
Not the Only Bearish Factor
BTC’s structural similarities to the textbook analysis by Richard Wyckoff is not the only sign suggesting a retracement is imminent.
A trader the chart below this past week.
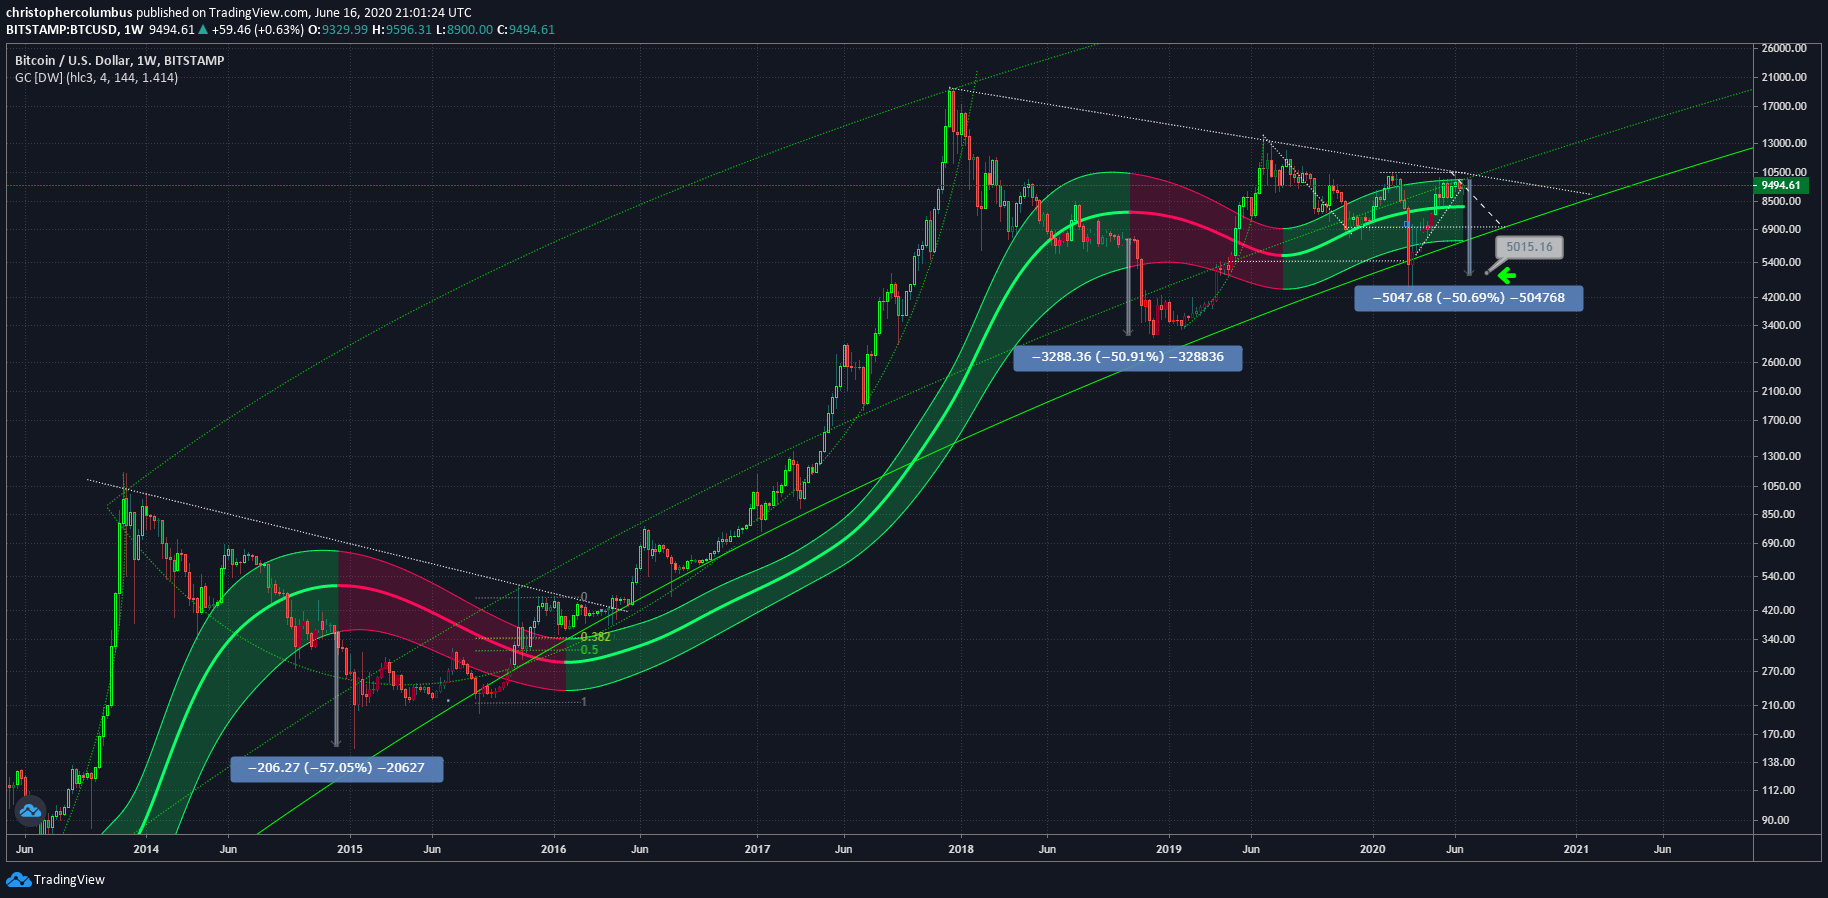
It shows Bitcoin’s macro price action alongside an indicator called the “Gaussian Channel,” which trended higher for all of 2016-2017’s bull market.
Each time the channel flipped red over the past five years, BTC retraced 50%. In 2018, the indicator flipped red to precede the drop from $6,000 to $3,150; in late-2014, the indicator predicted the decline from the $400 range to sub-$200 prices.
Macro BTC price chart from trader "Dave the Wave" (@Davonwave on Twitter). Chart from
While the channel has yet to flip bearish yet, it is about to as prices have stalled in the $9,000s for weeks on end. Should it cross red and considering the historical precedent, a strong retracement in the Bitcoin price may follow.
Related Reading: Crypto Tidbits: BTC Fails at $10k, Ethereum Coins Explode, Coinbase Looks to Add 18 Altcoins
Featured Image from Shutterstock
Price tags: xbtusd, btcusd, btcusdt
Charts from
Bitcoin Is Still Tracing a Textbook Pattern Predicting a Crash to $8,000


