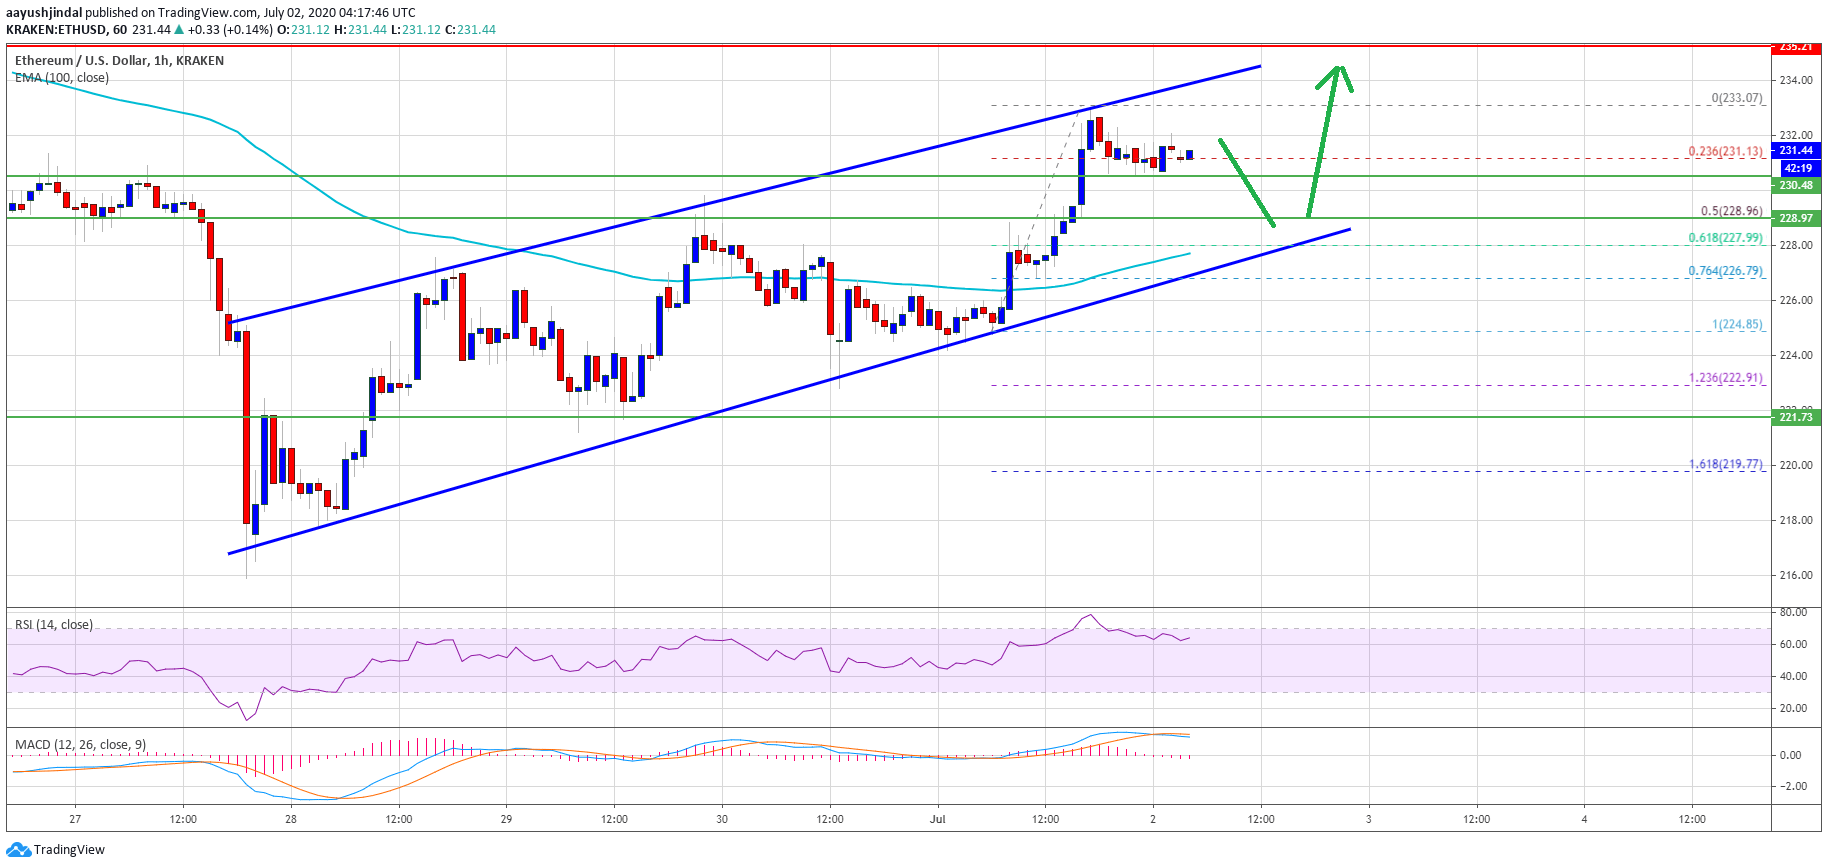
Ethereum is holding strong above the $225 support level against the US Dollar. ETH is slowly rising and it is likely to continue higher towards $235 and $240.
- Ethereum is following a bullish path and it recently spiked above the $230 resistance level.
- The price could correct a few points, but the $228 and $225 levels are important supports.
- This week’s followed a crucial ascending channel is active with support near $228 on the hourly chart of ETH/USD (data feed via Kraken).
- The pair is likely to continue higher towards $235 after a short-term downside correction.
Ethereum Price is Showing Positive Signs
In the past three days, Ethereum price followed a bullish path above the $220 pivot level against the US Dollar. ETH price gained pace above the $225 resistance level and the 100 hourly simple moving average.
The recent upward move was positive, and ether traded above the $228 and $230 resistance levels. It traded to a new weekly high at $233 and it is currently correcting lower. It tested the 23.6% Fib retracement level of the recent upward move from the $225 swing low to $233 high.
Chart fromThe channel support is close to the 50% Fib retracement level of the recent upward move from the $225 swing low to $233 high. It seems like ether price might a strong buying interest near the channel support, $226, and the 100 hourly SMA.
Dips Supported in ETH
If Ethereum corrects lower, the channel support and the 100 hourly SMA could provide a strong support. Any further losses may perhaps lead the price towards the $222 support zone. A successful close below the $222 support will most likely decrease the chances of a sustained upward move towards the $250 level in the coming sessions.Hourly MACD – The MACD for ETH/USD is slowly losing pace in the bullish zone.
Hourly RSI – The RSI for ETH/USD is currently correcting lower towards the 50 level.
Major Support Level – $228 Major Resistance Level – $232 Risk disclaimer: 76.4% of retail CFD accounts lose money.


