Bitcoin is holding the $9,120 and $9,200 support levels against the US Dollar. However, BTC is facing a confluence of resistance near $9,400, above which it could start a strong rally.
- Bitcoin is slowly rising and trading above the $9,200 support zone.
- The price is trading well below the $9,400 resistance, but above the 100 hourly simple moving average.
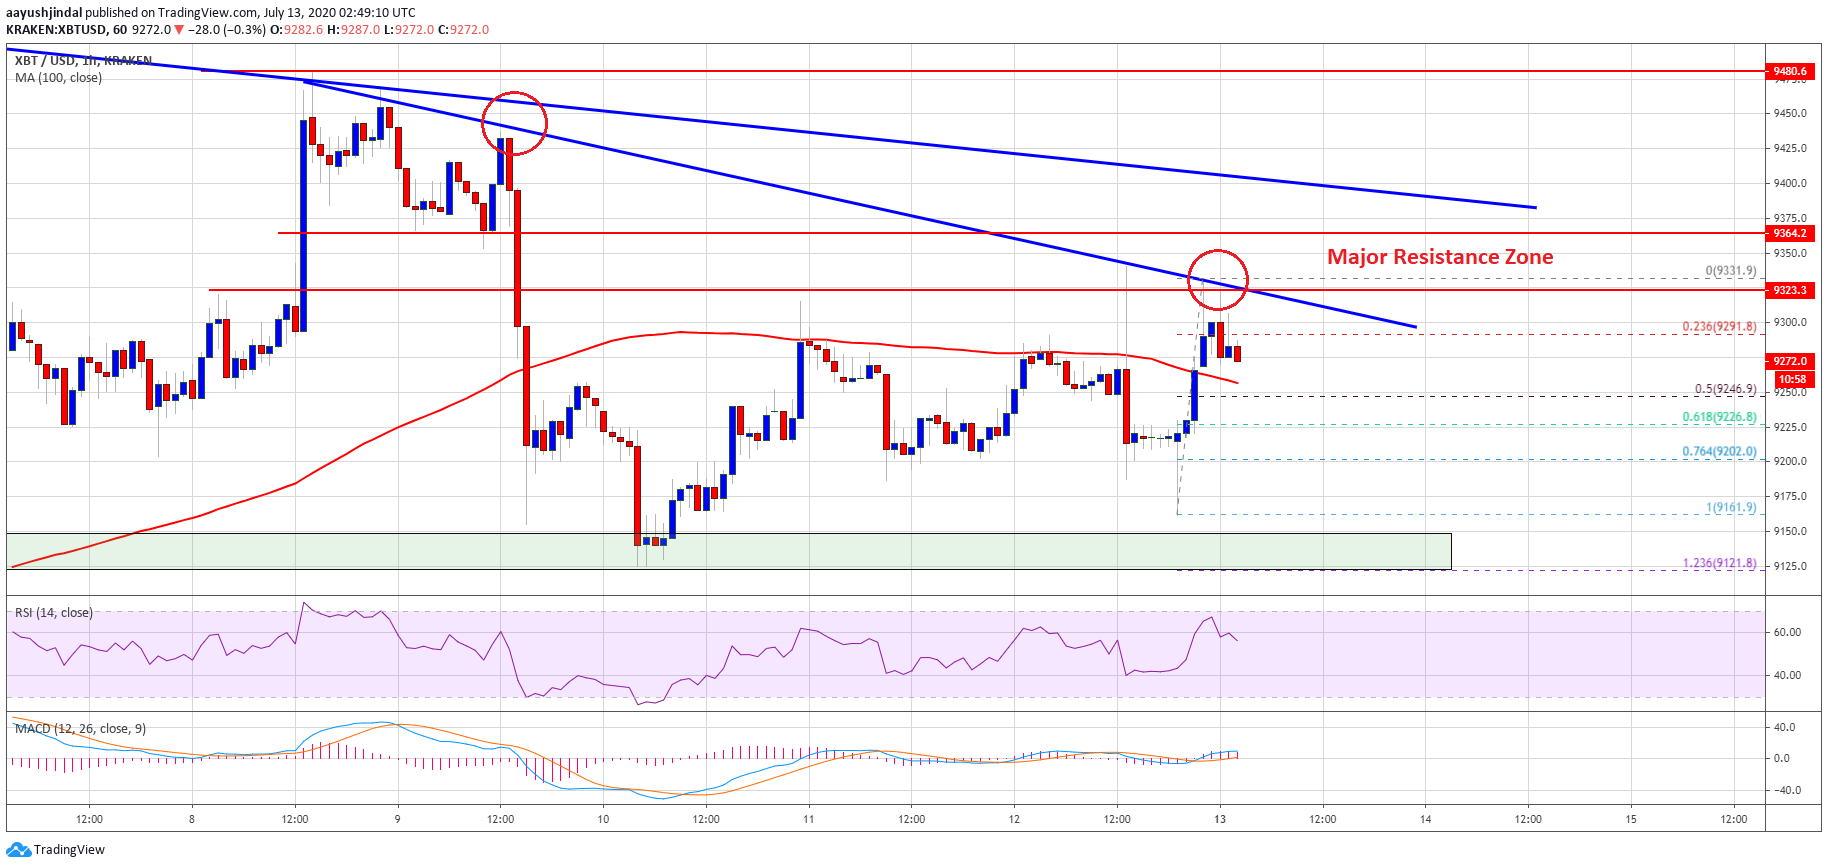
- There are two bearish trend lines forming with resistance near $9,320 and $9,380 on the hourly chart of the BTC/USD pair (data feed from Kraken).
- The pair must settle above both trend lines and $9,400 to start a strong upward move.
Bitcoin Price is Facing Hurdles
In the past few sessions, bitcoin consolidated above the $9,120 and $9,160 support levels against the US Dollar. The recent swing low was formed near $9,161 before BTC climbed higher.
It broke the $9,200 level and the 100 hourly simple moving average. The bulls pushed the price above the $9,300 level, but there was a lack in the bullish momentum. A high is formed near $9,331 and the price is currently correcting lower.
Bitcoin broke the 23.6% Fib retracement level of the recent wave from the $9,161 low to $9,331 high. It seems like there are two bearish trend lines forming with resistance near $9,320 and $9,380 on the hourly chart of the BTC/USD pair.
Bitcoin price testing $9,300: Source:
There are many important hurdles forming for the bulls, starting with $9,320 and up to $9,400. Therefore, it won’t be easy for them to gain strength. If they succeed in clearing both trend lines and $9,400, there are chances of a sustained upward move.
In the mentioned case, there are high chances of an upside break above the $9,500 resistance level. The next key hurdles are near the $9,600 and $9,800 levels.
Fresh Drop in BTC
The first major support is near the $9,250 level, the 100 hourly SMA, and the 50% Fib retracement level of the recent wave from the $9,161 low to $9,331 high.
If bitcoin fails to stay above the $9,250 support, it could continue to move down towards the $9,200 support. The main uptrend support is still near the $9,120 level, below which the bears are likely to take control in the coming sessions (as discussed in the weekly analysis).
Technical indicators:
Hourly MACD – The MACD is slowly moving in the bullish zone.
Hourly RSI (Relative Strength Index) – The RSI for BTC/USD is currently well above the 50 level.
Major Support Levels – $9,200, followed by $9,120.
Major Resistance Levels – $9,320, $9,380 and $9,400.


