Bitcoin price is in a precarious location. The asset set a new all-time high just days ago but is trading below the record and starting to decline. The shifting momentum is now presenting in technical indicators supplying bearish signals, adding to the double top narrative that’s been building since failing to break $20,000.
Here are the factors to potentially fear that could point to a sharp correction in the first-ever cryptocurrency and why they are so critical.
Trend-Focused Technical Tools Suggest Crypto At Tipping Point, Correction Imminent
Bitcoin has had an incredible year, capping it off with a new all-time high set. But the expectations that once the cryptocurrency got here it would blast right on through and the new bull market would begin, are turning into a realization that the resistance level could prove too strong a second time – new record or not.
From just under $20,000 the cryptocurrency has pulled back by $1000 so far. But it was enough to cause nearly every technical indicator to begin to turn bearish, forewarning of an impending collapse.
Related Reading | Ten Different Bearish Divergences Stack Against Bitcoin, But Drop Has Yet To Arrive
However, the price action judging by daily candles is incredibly mixed, making it difficult to tell if the tides are turning in favor of bears temporarily, or if bulls are still in full control and just feigning weakness.

Daily Renko potential double top according to ATR, Fisher Transform confirms trend change | Source:
Seeing Both Sides Of The Coin: Is A Double Top In Bitcoin Possible?
Certain tools and charting methods have been developed to clear out that noise that makes seeing when trends come to an end that much more difficult. Aside from traditional Japanese candlesticks and line charts, analysts also rely on Kagi, Renko, or Point and Figure type charts.
While the candles you typically see on price charts focused on each trading session’s open, high, low, and close, Renko only includes the open and close of each, ignoring the highs and lows caused by meaningless intraday volatility.
These Renko charts are potentially signaling that Bitcoin has formed a double top based on the ATR or average true range. Coinciding with the bearish “brick” formation, the Smoothed Fisher Transform has also flipped bearish at a +2.22 standard deviation.
Related Reading | Why The Double Top Narrative In Bitcoin Doesn’t Make Sense
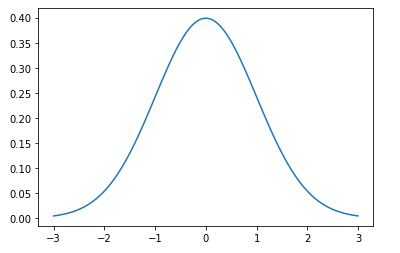
The Fisher Transform is a technical indicator based on probabilities, with the higher the standard deviation, the lower the chances are for prices to increase or decrease.

At a zero standard deviation, probabilities are split 50-50
Essentially, with an over +2 standard deviation, the chances the cryptocurrency goes much higher in this current rally are low. However, just because the asset is showing signs of a double top, doesn’t necessarily mean it will confirm.
As other traders have pointed out, for a double-top to be confirmed as valid, it must break down through the swing low between each top – nestled at $3,200. The scenario isn’t impossible, but like what has been discussed about probabilities prior, is highly unlikely at this point.
Featured image from Deposit Photos, Charts from TradingView.com


