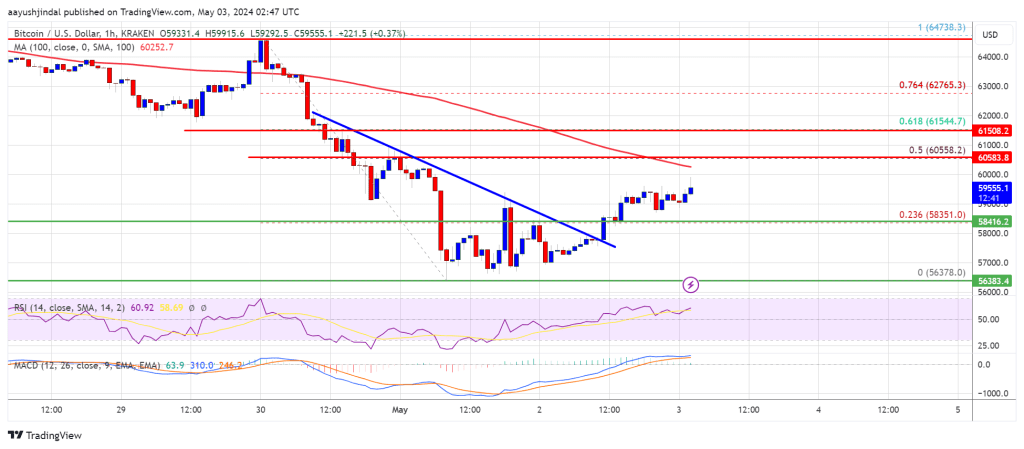
Bitcoin price found support near the $56,350 zone. BTC is recovering higher, but the bears might be active near the $60,000 resistance zone.
- Bitcoin is attempting a recovery wave from the $56,350 support zone.
- The price is trading below $60,000 and the 100 hourly Simple moving average.
- There was a break above a key bearish trend line with resistance at $57,800 on the hourly chart of the BTC/USD pair (data feed from Kraken).
- The pair could struggle to clear the $60,000 and $60,500 resistance levels.
Bitcoin Price Faces Resistance
Bitcoin price extended losses below the $60,000 level to enter a short-term bearish zone. BTC even traded below the $58,000 level before the bulls appeared near the $56,350 level.
A low was formed at $56,378 and the price started a decent recovery wave. The price climbed above the $58,000 resistance zone. There was a break above a key bearish trend line with resistance at $57,800 on the hourly chart of the BTC/USD pair.The price climbed above the 23.6% Fib retracement level of the downward wave from the $64,738 swing high to the $56,378 low. Bitcoin is still trading below $60,000 and the 100 hourly Simple moving average.
Immediate resistance is near the $60,000 level. The first major resistance could be $60,500. It is close to the 50% Fib retracement level of the downward wave from the $64,738 swing high to the $56,378 low. The next key resistance could be $61,500.


