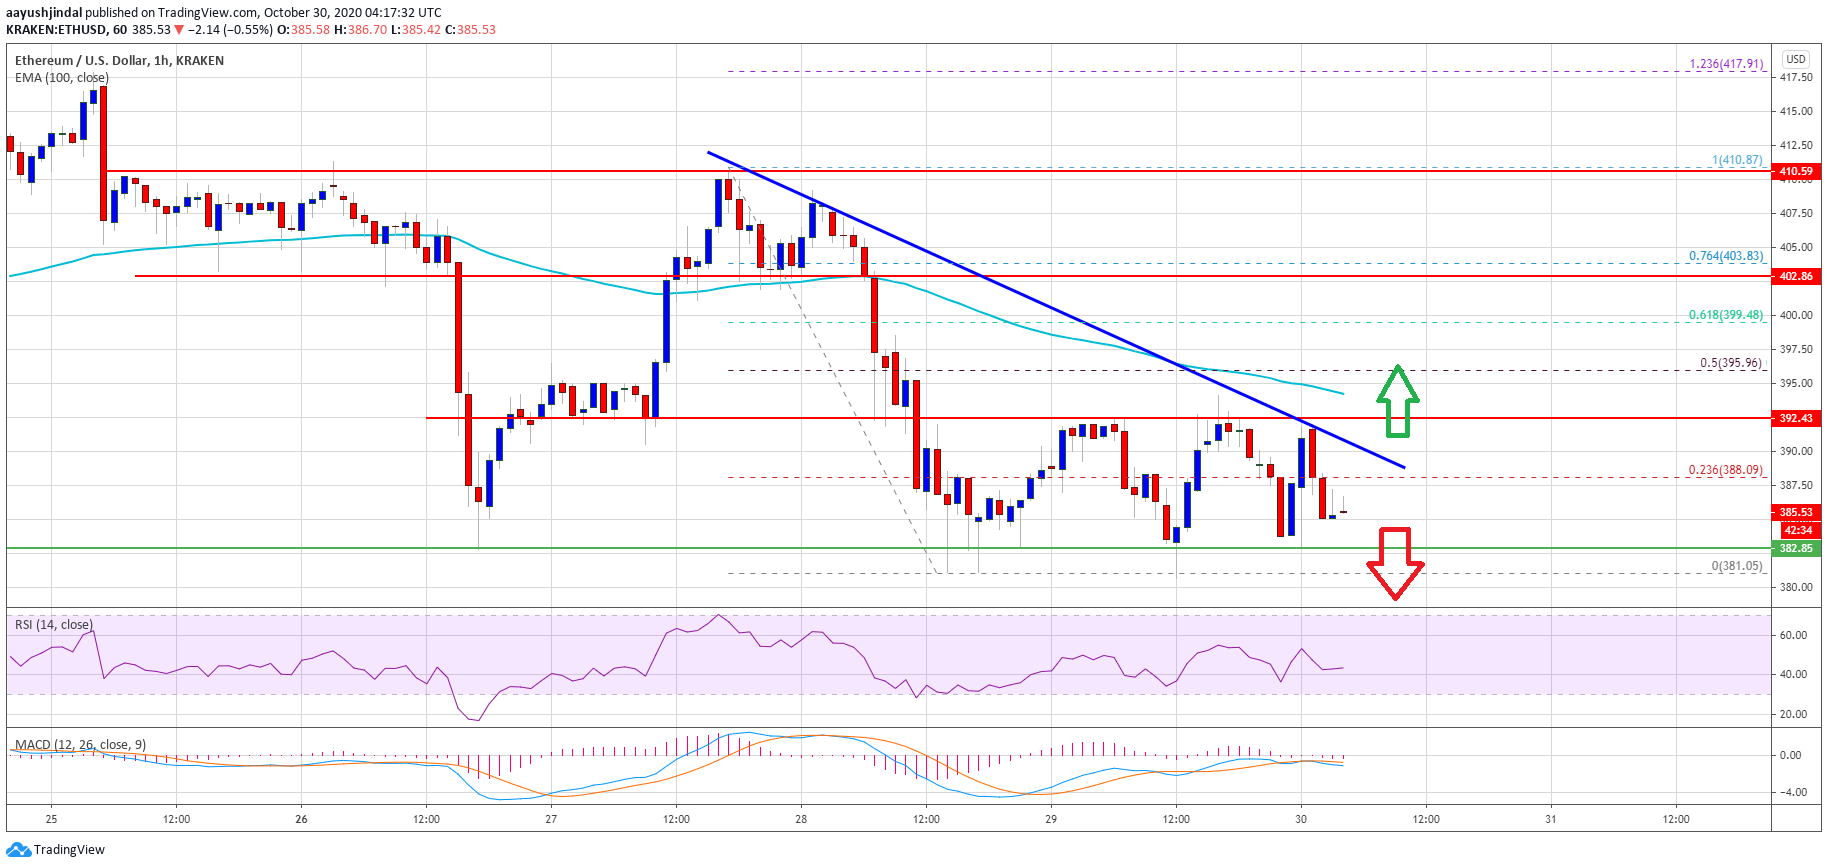
Ethereum is stuck in a crucial range above the $382 support against the US Dollar. ETH price could either jump above $392 or it might nosedive below $380.
- Ethereum is struggling to stay above the key $382 and $380 support levels.
- The price is currently trading in a range above the $382 support and below the $392 resistance.
- There is a crucial bearish trend line forming with resistance near $390 on the hourly chart of ETH/USD (data feed via Kraken).
- The pair could start a fresh increase if it clears the $390 and $392 resistance levels.
Ethereum Price is Facing Heavy Resistance
In the past few sessions, Ethereum saw an increase in selling pressure below the $400 support. ETH price settled below the $392 support and the 100 hourly simple moving average.
The price even spiked below the $385 support, but it remained stable above the $382 support. Recently, bitcoin price started a fresh increase from the $13,000 support, but ether price remained in a range. It seems like the price is trading in a range above the $382 support and below the $392 resistance.
An initial resistance is near the 23.6% Fib retracement level of the recent decline from the $410 high to $382 swing low. There is also a crucial bearish trend line forming with resistance near $390 on the hourly chart of ETH/USD.
Source:
The main resistance is near the $392 level and the 100 hourly simple moving average. The next resistance is near the $395 level or the 50% Fib retracement level of the recent decline from the $410 high to $382 swing low.
Ether price must break the $392 resistance and then gain strength above the $395 barrier to move back into a positive zone. In the stated case, the price could climb above $400 and $405.
Downside Break in ETH?
If Ethereum fails to clear the $392 and $395 resistance levels, there is a risk of a bearish break. The key range support seems to be forming near the $382 and $380 levels.
A clear break below the range support might open the doors for a massive decline below the $380 support zone. The next major support on the downside is near the $365 level.
Technical Indicators
Hourly MACD – The MACD for ETH/USD is struggling to move back into the bullish zone.
Hourly RSI – The RSI for ETH/USD is now well below the 50 level.
Major Support Level – $382
Major Resistance Level – $392


