Algorand is currently bullish on its chart at the time of writing. Fifa’s governing body announced Algorand to be the official blockchain partner of the World Cup competition. It is set to happen in November. Ever since that announcement, the coin displayed positive price action.
After the coin fell through its long-standing support line of $0.66, the traders could have used that opportunity as an entry point. The news of Fifa’s World Cup news snatched that opportunity away from traders.
In a matter of a day, the coin soared by almost 14%. Algorand has broken past its immediate price ceilings and could aim for other resistances with persistent bullish price action. Buying strength has registered substantial growth owing to the new development.
Algorand Price Analysis: Four-Hour Chart
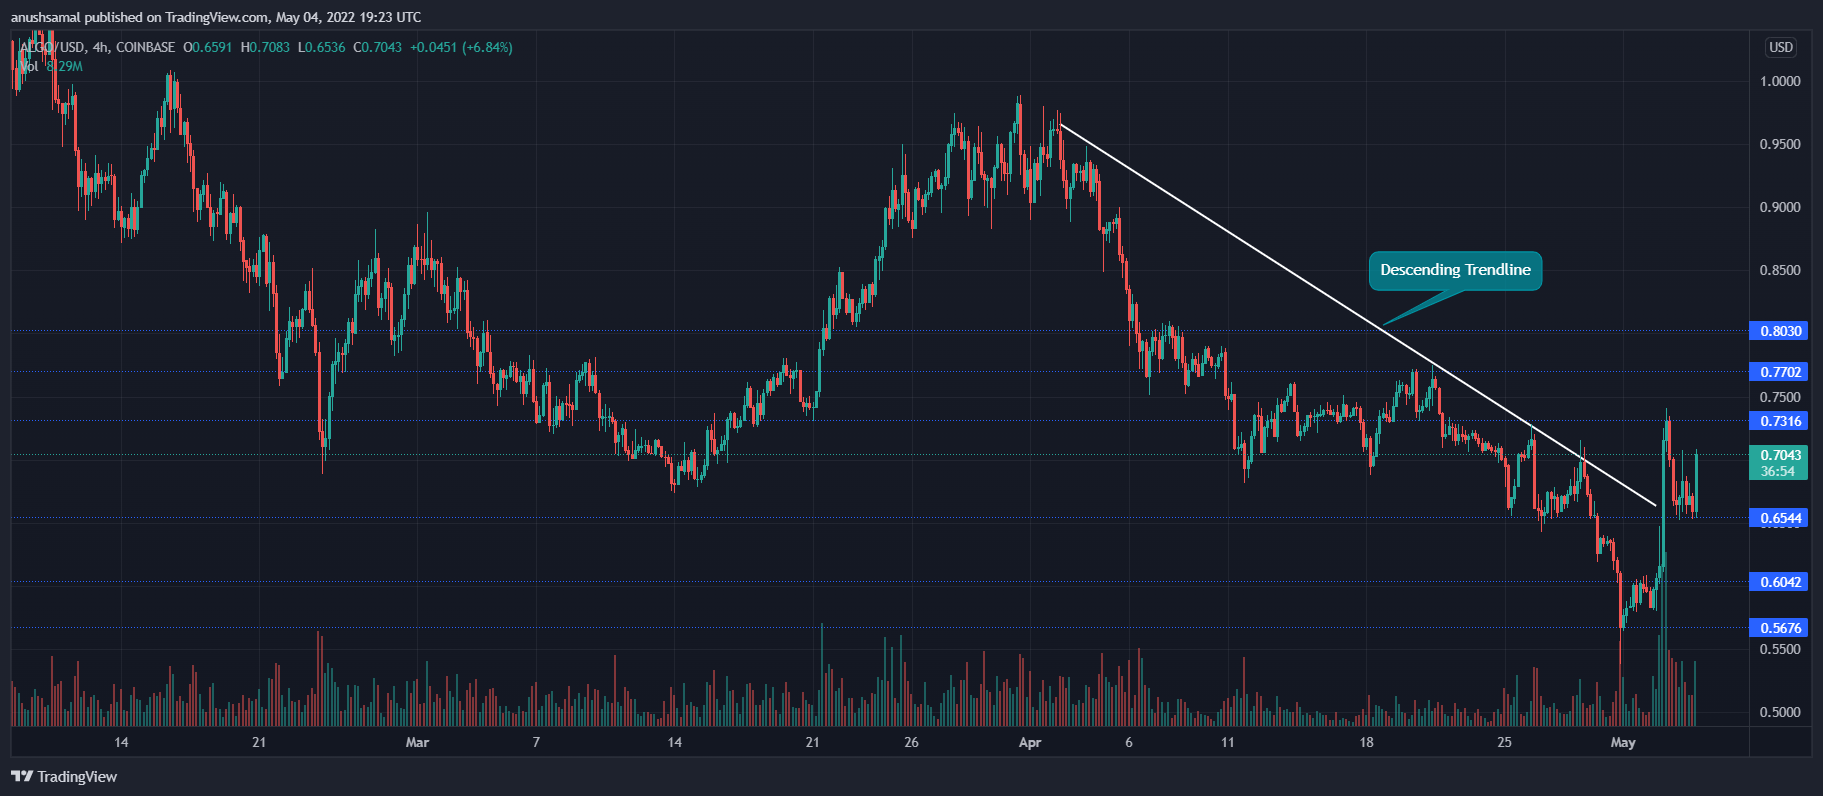
Algorand was priced at $0.704 on the four-hour chart. Image Source:
Algorand was priced at $0.704 at the time of writing. On the four-hour chart, the coin depicts a descending resistance trendline. Ever since April, the bears had taken over the market. The buyers remained wary of the asset with bouts of increased buying pressure in the middle.
Immediate support for the coin was at $0.664. The aforementioned line was a resistance mark but the coin flipped that into a support region for itself. Immediate resistance for ALGO stood at $0.77 and then at $0.80, breaching which the coin could eye for $1.
Traders have responded to the recent development well because there has been a considerable improvement in buying strength. In case of a pullback, ALGO could fall to trade at the $0.560 price level. The trading volume of the coin was seen in green as buyers outnumbered sellers at the time of writing.
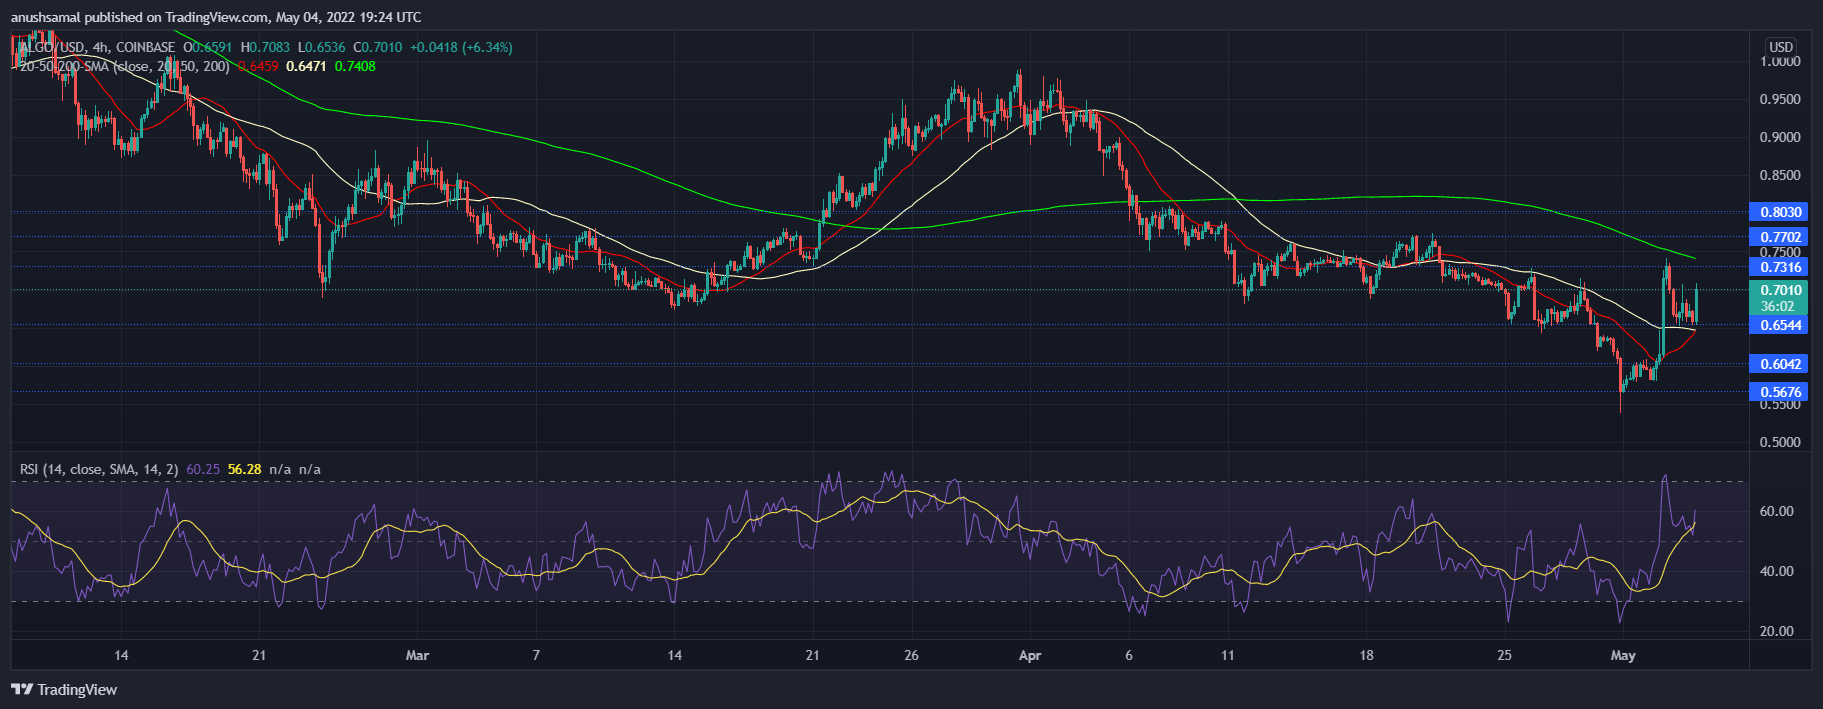
Algorand displays a sharp increase in buying pressure on the four-hour chart. Image Source:
The price of ALGO was seen parked above the 20-SMA line and that indicates bullishness on the charts. The reading meant that prices were driven by buyers in the market as they gained momentum. The asset was also seen trading above the 50-SMA which is also considered quite bullish.
On the Relative Strength Index, the coin indicator displayed an uptick. Over the last trading sessions, RSI had visited the overbought region. A price correction followed thereafter. At the time of writing, the market remained bullish and so did the buying strength.
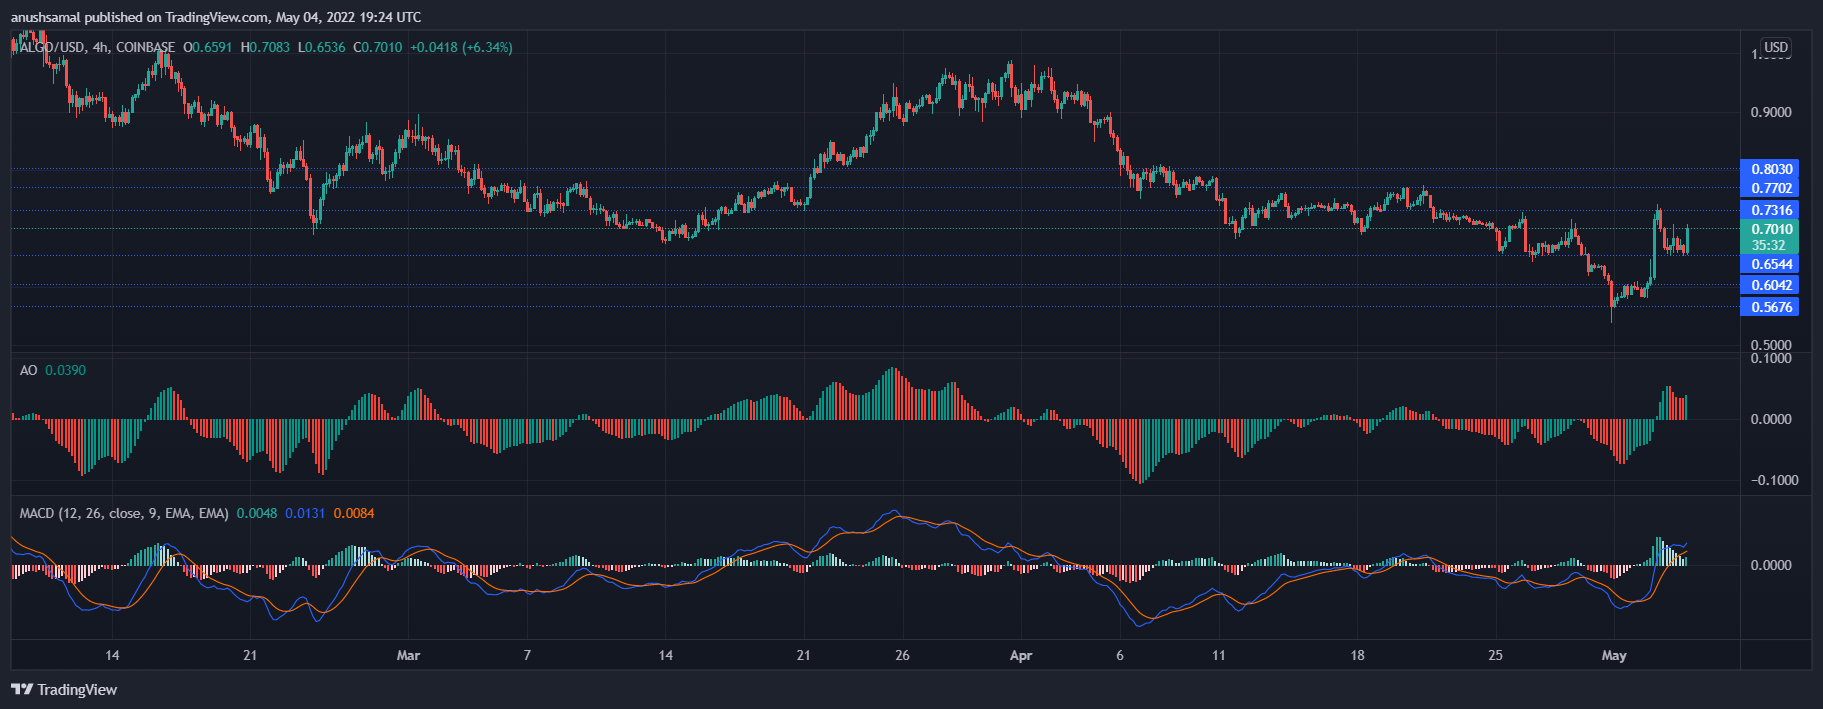
Algorand depicted bullish market momentum on the four-hour chart. Image Source:
MACD underwent a bullish crossover and flashed green signal bars. The indicator determines the current and the upcoming market momentum. The reading on the MACD displayed bullishness which meant that ALGO could target moving northwards over the upcoming trading sessions.
Awesome Oscillator was also bullish as it painted a positive price action. The indicator displayed a single green histogram after a series of red histograms. AO’s reading established that ALGO could attempt to rally again over the next trading sessions.
Disclaimer: The information found on NewsBTC is for educational purposes
only. It does not represent the opinions of NewsBTC on whether to buy, sell or hold any
investments and naturally investing carries risks. You are advised to conduct your own
research before making any investment decisions. Use information provided on this website
entirely at your own risk.