Even taking Bitcoin’s Monday pump from $9,000 to $9,400 into account, the cryptocurrency is still in a macro consolidation.
Some traders have joked that considering the length of BTC’s consolidation already, it could go on for months longer. One trader, in fact, postulated that it may be until late-Q3 or Q4 of this year until the crypto market establishes a macro trend.
An analyst, however, has observed that Bitcoin is at the apex of a multi-month triangle pattern. And fortunately for bulls, analysts say that buyers are in control.
Related Reading: What Death Spiral? Bitcoin Hash Rate Surges to Fresh All-Time High
Bitcoin’s Multi-Month Consolidation Is Reaching a Head… Finally
Bitcoin’s price performance over the past two months has undoubtedly been boring. With BTC registering a series of higher lows and lower highs, the cryptocurrency is clearly at an impasse.
The chart below by a cryptocurrency trader on July 7th depicts Bitcoin’s indecision rather well. Per the chart, BTC is trading in a two-month-long symmetrical triangle, with the asset centering around $9,300.
What’s important about the triangle is that Bitcoin has reached its apex, indicating an imminent breakout.
Bitcoin's "one triangle to rule them all" chart from trader "ChimpZoo" (@thinkingbitmex on Twitter). Chart from
Volatility indicators suggest that this breakout will be of macro importance.
As reported by NewsBTC, Bitcoin’s realized volatility (historical volatility index) recently reached lows not seen since March/April of 2019. Volatility is also slightly above the lows of November 2018, prior to a 50% crash that took Bitcoin from ~$6,400 to $3,200.
Bitcoin Historical Volatility Index, one-day chart, BitMEX chart from "XC" (@Runtheirstops on Twitter). Chart from
Bitcoin Bulls Are Winning
With a massive Bitcoin breakout coming, investors may be wondering which way the technicals lean.
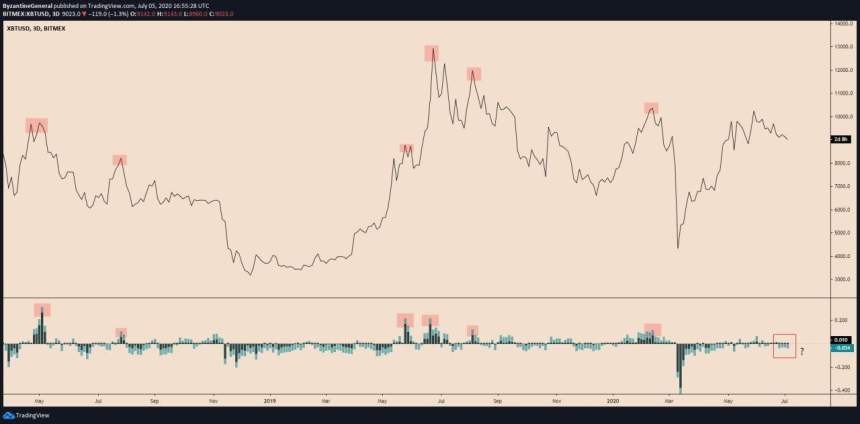
An analyst shared the chart below last week, showing that if Bitcoin tops here, it will be like nothing seen in the past two years. Each of BTC’s tops over the past two years has been marked by a positive BitMEX funding rate.
At current, the BitMEX funding rate is running neutral to negative, boding well for bulls.

Chart of BTC's price over the past ~two years with funding rate indicator from trader Byzantine General (@ByzGeneral on Twitter). Chart from
Corroborating the expectations of upside is the three-day stochastic RSI. An analyst observed that the indicator is undergoing a textbook bullish crossover, last seen in March after BTC hit $3,700.
Accumulate Anyway
On the off chance that Bitcoin doesn’t break higher from this triangle, analysts think it’s wise to accumulate anyway.
Matt D’Souza, the CEO of Blockware Mining, remarked on the importance of accumulation:
“Buying at $8500 vs $9300 has 0 relevance when the objective should be capturing a market cycle over the next 18-36 months that could print $20,000, $50,000 or $100,000+. Short term scalping is a distraction, it’ll lead to missing the big move. The real money is made in the sitting. […] Holding coin is critical, dollar cost averaging smoothens your cost basis”
Many cryptocurrency proponents agree. If one is certain that BTC appreciates exponentially, worrying about a few percentage points here and there may be unnecessary.
Featured Image from Shutterstock
Price tags: xbtusd, btcusd, btcusdt
Charts from
Bitcoin Is at the Apex of a Multi-Month Triangle — and Bulls Are in Control


