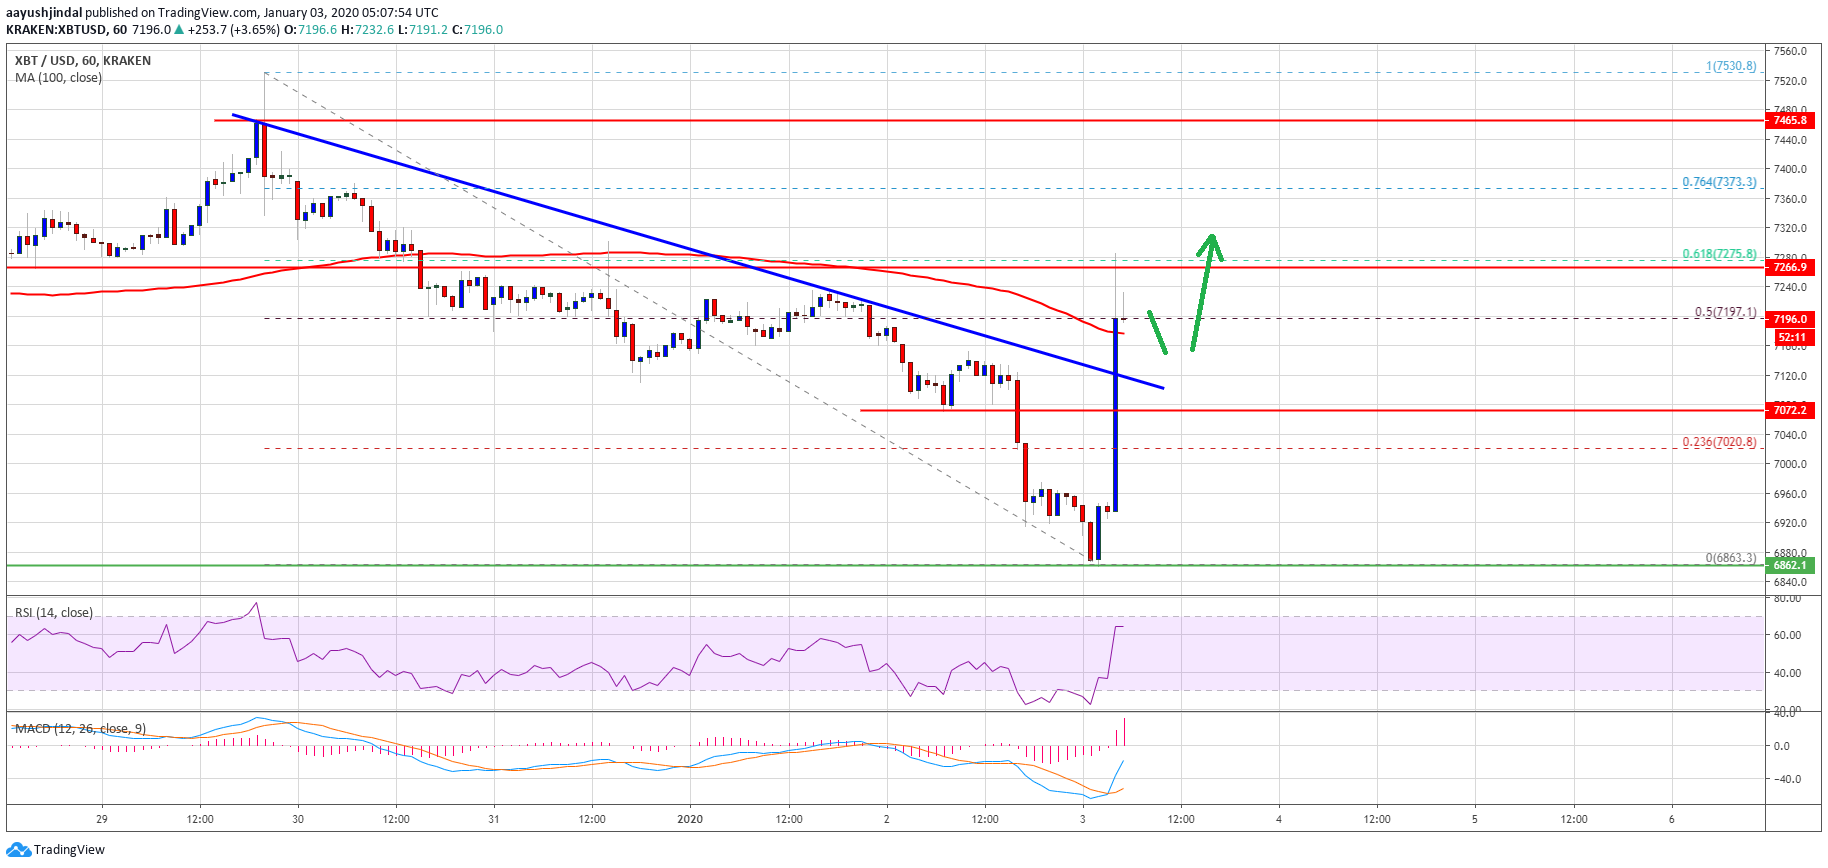
- Bitcoin started a strong upward move from the $6,880 support area against the US Dollar.
- The price is reversing losses and it is now well above $7,100.
- There was a break above a key bearish trend line with resistance near $7,120 on the hourly chart of the BTC/USD pair (data feed from Kraken).
- The current technical structure suggests reversal signs towards the $7,500 resistance area.
Bitcoin price is climbing with a bullish angle above $7,000 against the US Dollar. BTC is likely to accelerate higher if it clears the $7,260 resistance.
Bitcoin Price Analysis
Recently, there was a downside extension in bitcoin below the $7,100 and $7,000 support levels against the US Dollar. BTC price spiked towards the $6,880 support and traded to a new 2020 low at $6,863.
However, the bulls took a stand, resulting in a sharp upward move above the $7,000 resistance. Besides, there was a break above the $7,080 resistance area. More importantly, there was a break above a key bearish trend line with resistance near $7,120 on the hourly chart of the BTC/USD pair.
The pair spiked above the 50% Fib retracement level of the downward move from the $7,530 high to $6,863 low. Though, the upward move was capped by the $7,260 resistance area.
Additionally, the price is facing hurdles near the 61.8% Fib retracement level of the downward move from the $7,530 high to $6,863 low. Bitcoin is currently correcting lower below $7,200.
On the downside, an initial support is near the $7,120 level and the broken trend line. The next major support is near the $7,080 level, below which the price is likely to resume its downtrend.
Conversely, the price might continue to rise above the $7,260 resistance. The next major resistance is near the $7,400 level. An intermediate resistance is the 76.4% Fib retracement level of the downward move from the $7,530 high to $6,863 low.
If the price continues to rise above $7,380 and $7,400, the next stop for the bulls may perhaps be $7,460 and $7,500. Any further gains could lead the price towards the $7,500 resistance area in the coming sessions.

Looking at the , bitcoin price is reversing losses above $7,100 and the 100 hourly SMA. If there is another surge above $7,260, it will most likely confirm a trend change and a fresh increase towards $7,500.
Technical indicators:
Hourly MACD – The MACD is currently gaining strength in the bullish zone.
Hourly RSI (Relative Strength Index) – The RSI for BTC/USD is now well above the 50 level.
Major Support Levels – $7,120 followed by $7,080.
Major Resistance Levels – $7,260, $7,380 and $7,460.


