- A sudden bounce back led bitcoin to register its biggest daily gain in seven weeks.
- Earlier this week, the cryptocurrency had fallen by up to 9.91 percent on Coinbase exchange.
- The latest push upwards flashes an interim bullish setup.
Bitcoin on Wednesday surged by more than 10 percent to register its biggest daily gain since October 25.
The leading cryptocurrency established an intraday high of $7,448.24 as of 2200 UTC. Notably, the move uphill came shortly after bitcoin had plunged to its seven-month low below $6,500. That largely negated bitcoin’s week-to-date losses to 0.45 percent. At its highest, those declines were approx 13 percent.
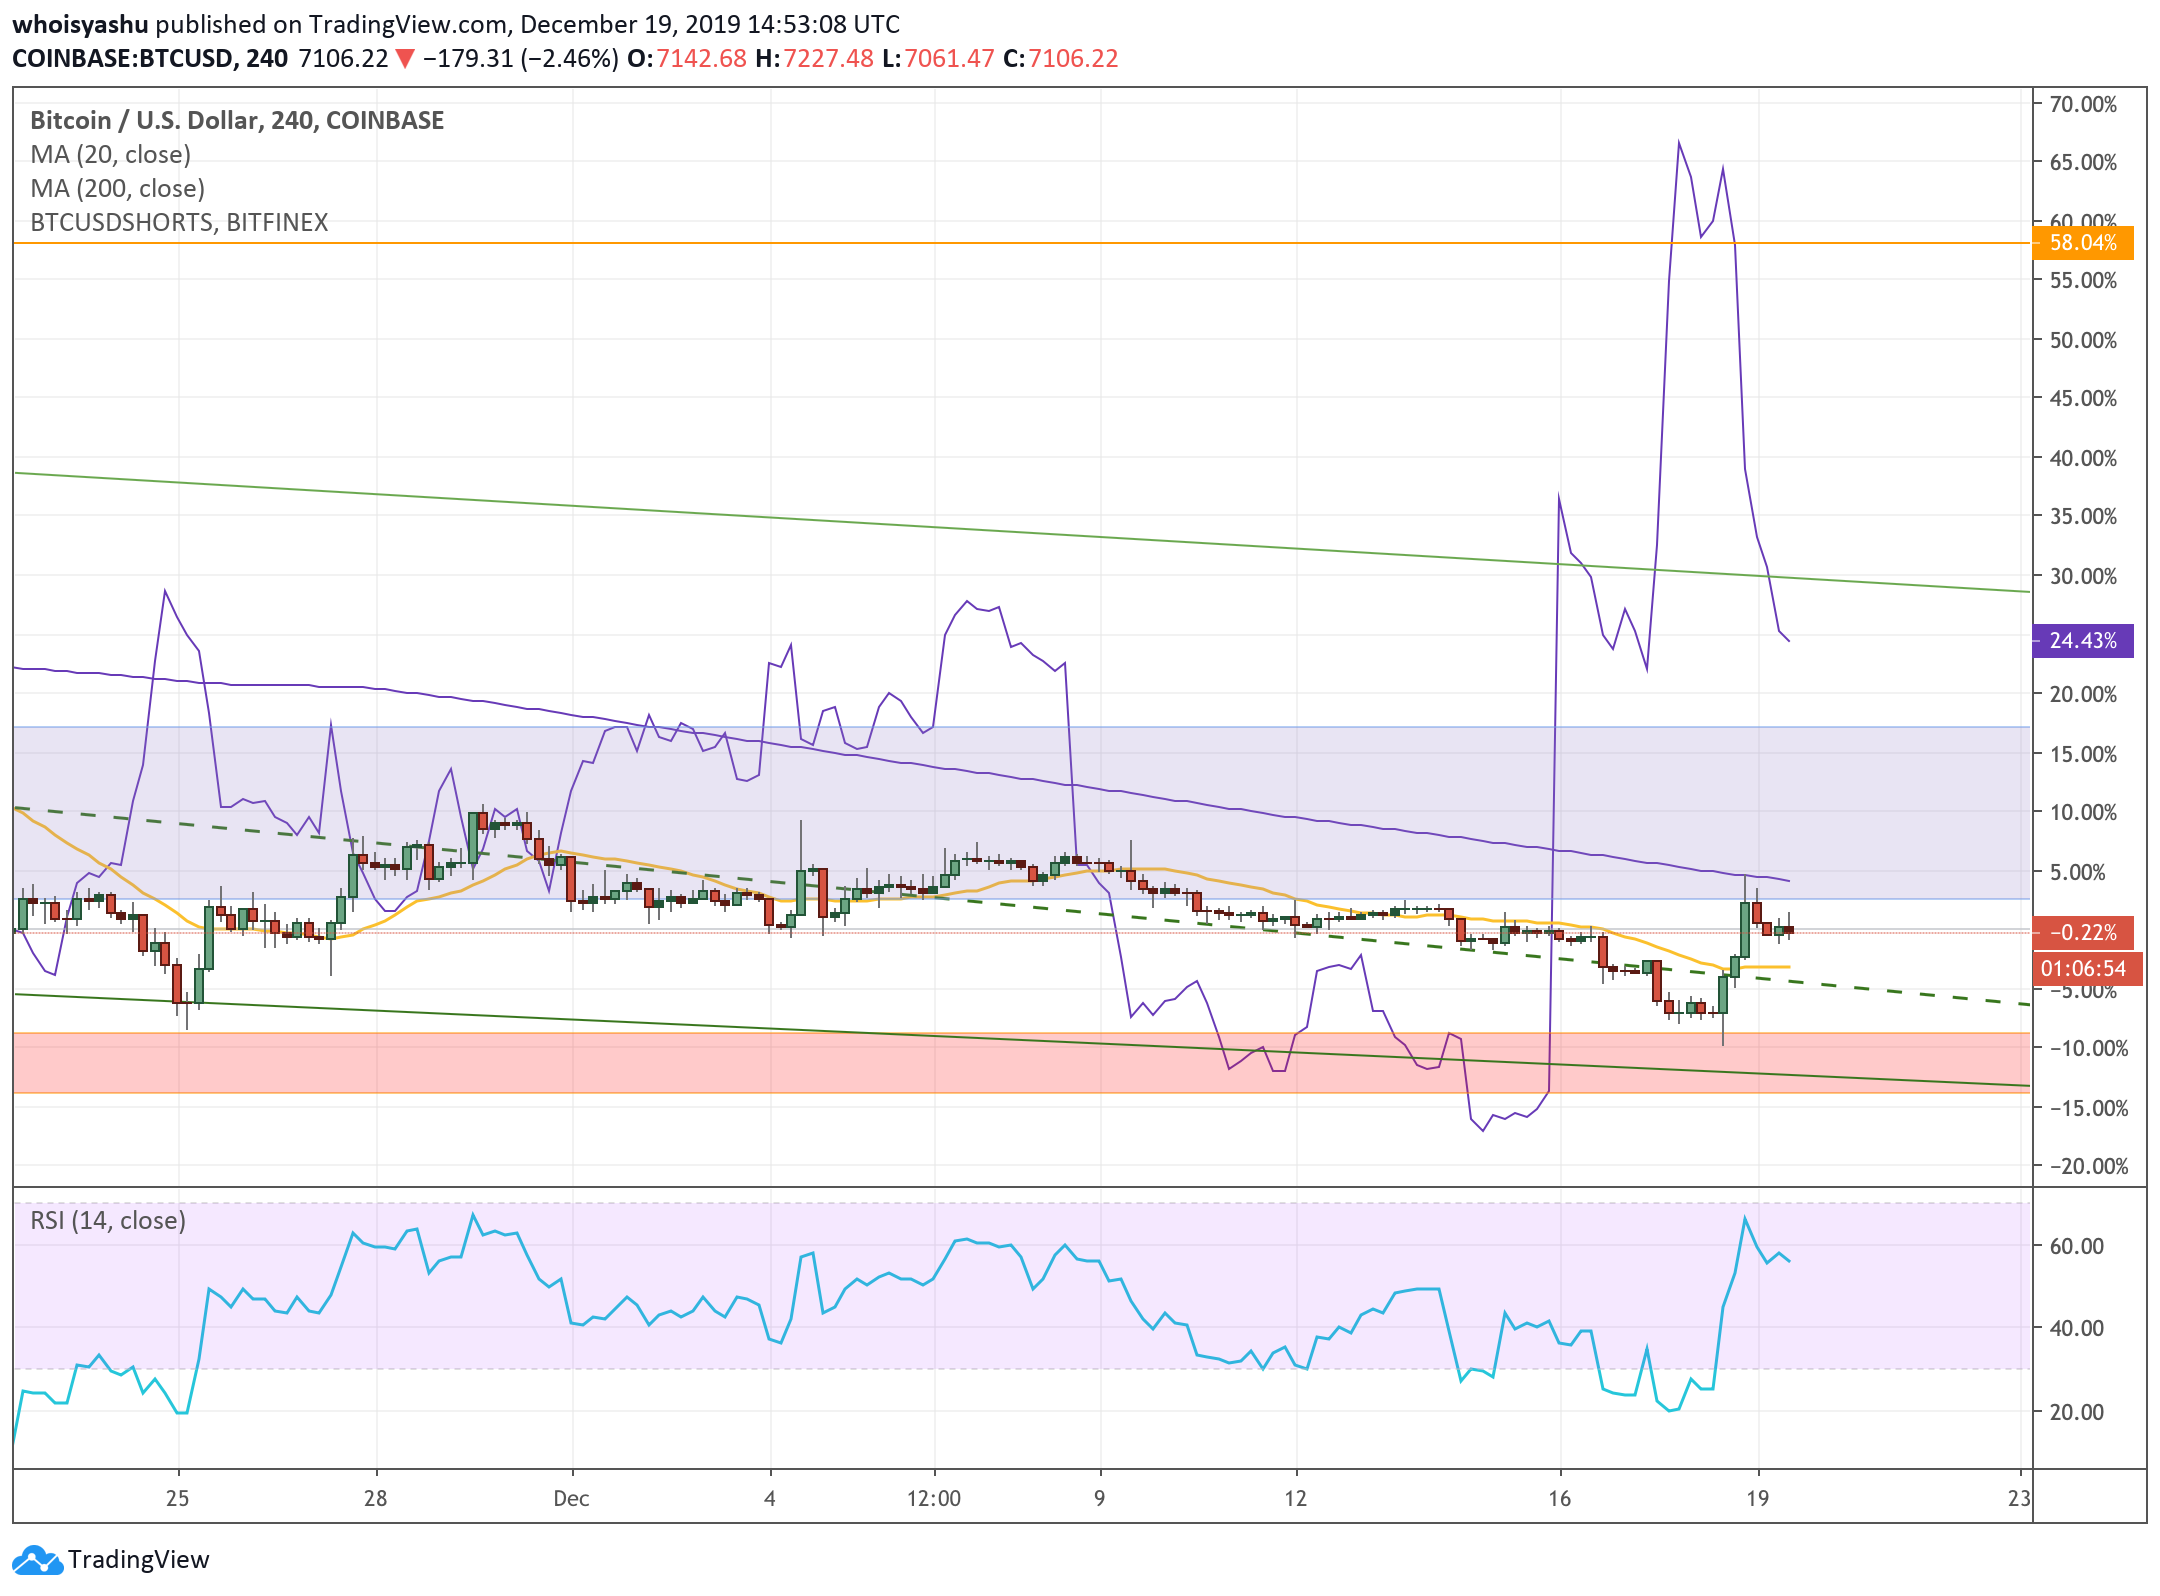
The sudden spike also coincided with a drop in Short positions on BitFinex. As of midnight Wednesday, the BTCUSD Shorts started plunging. Two hours later, the BTC spot price established a local swing low across the leading exchanges.

The positive correlation shows that traders miscalculated bitcoin’s price drop below $6,500. They placed extended Short positions to benefit from a potential capitulation. Nevertheless, most of them had to Short Squeeze their positions, leading to the wild pump in the bitcoin price.
$9,000 Bitcoin Price Target
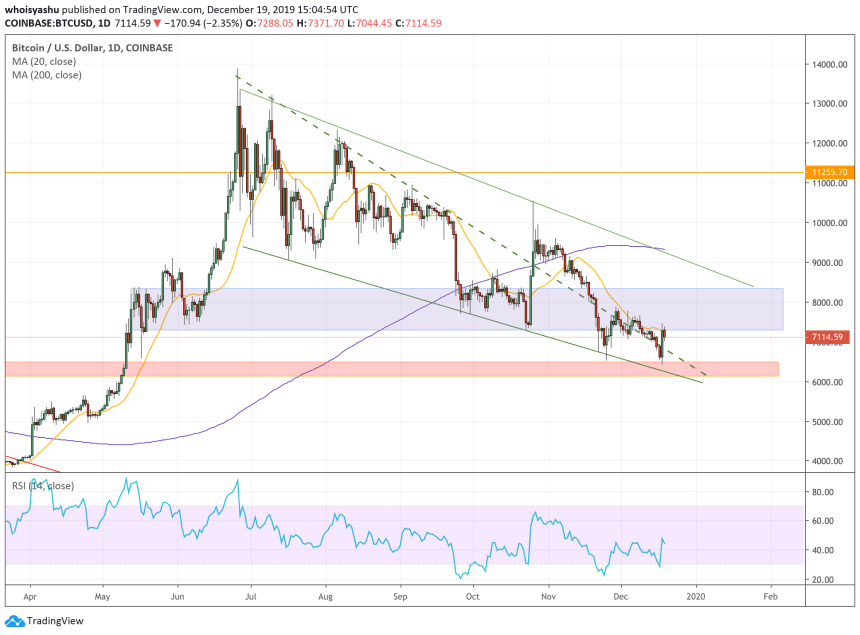
As NewsBTC predicted in its earlier analysis, bitcoin was eyeing a [strong] rebound upon testing the redded area as shown in the chart below. The report also discussed the potential of the price to close into the purpled region.

Wednesday’s price action showed an almost similar price movement. The bitcoin price rebounded from the mid-$6,400 region, which falls in the redded area. Meanwhile, a bounce-back action took the price into the purpled region, as confirmed by the local high of $7,448.24.
The price action overall confirms the setup discussed in NewsBTC’s earlier analysis. That being said, bitcoin has a likelihood of extending its upside momentum until it tests the Channel Support as resistance. For traders looking to enter medium-term positions, a Long entry towards $9,000 looks attractive.
Nevertheless, they should maintain a stop-loss order below the Channel support to minimize losses in the event of a trend reversal.
Bull Setup Not Confirmed Until…
While the latest push upwards flashes a decent bullish setup, optimists should consider a crucial resistance that could spoil the party.
The first price ceiling is the 20-daily Moving Average. It has historically served as an indicator to define bitcoin’s interim bias. That said, if bitcoin closes above it, the market’s interim sentiment turns bullish. And if the cryptocurrency closes below the MA, the sentiment flips to bearish.
As of now, bitcoin is trading right under the same 20-daily MA (the orange curve). Not unless it breaks above it, the likelihood of an extended downside momentum would be high – towards $5,000. Meanwhile, a jump above the said level could see the price eye $9,000.


