
Implications For Bitcoin Price
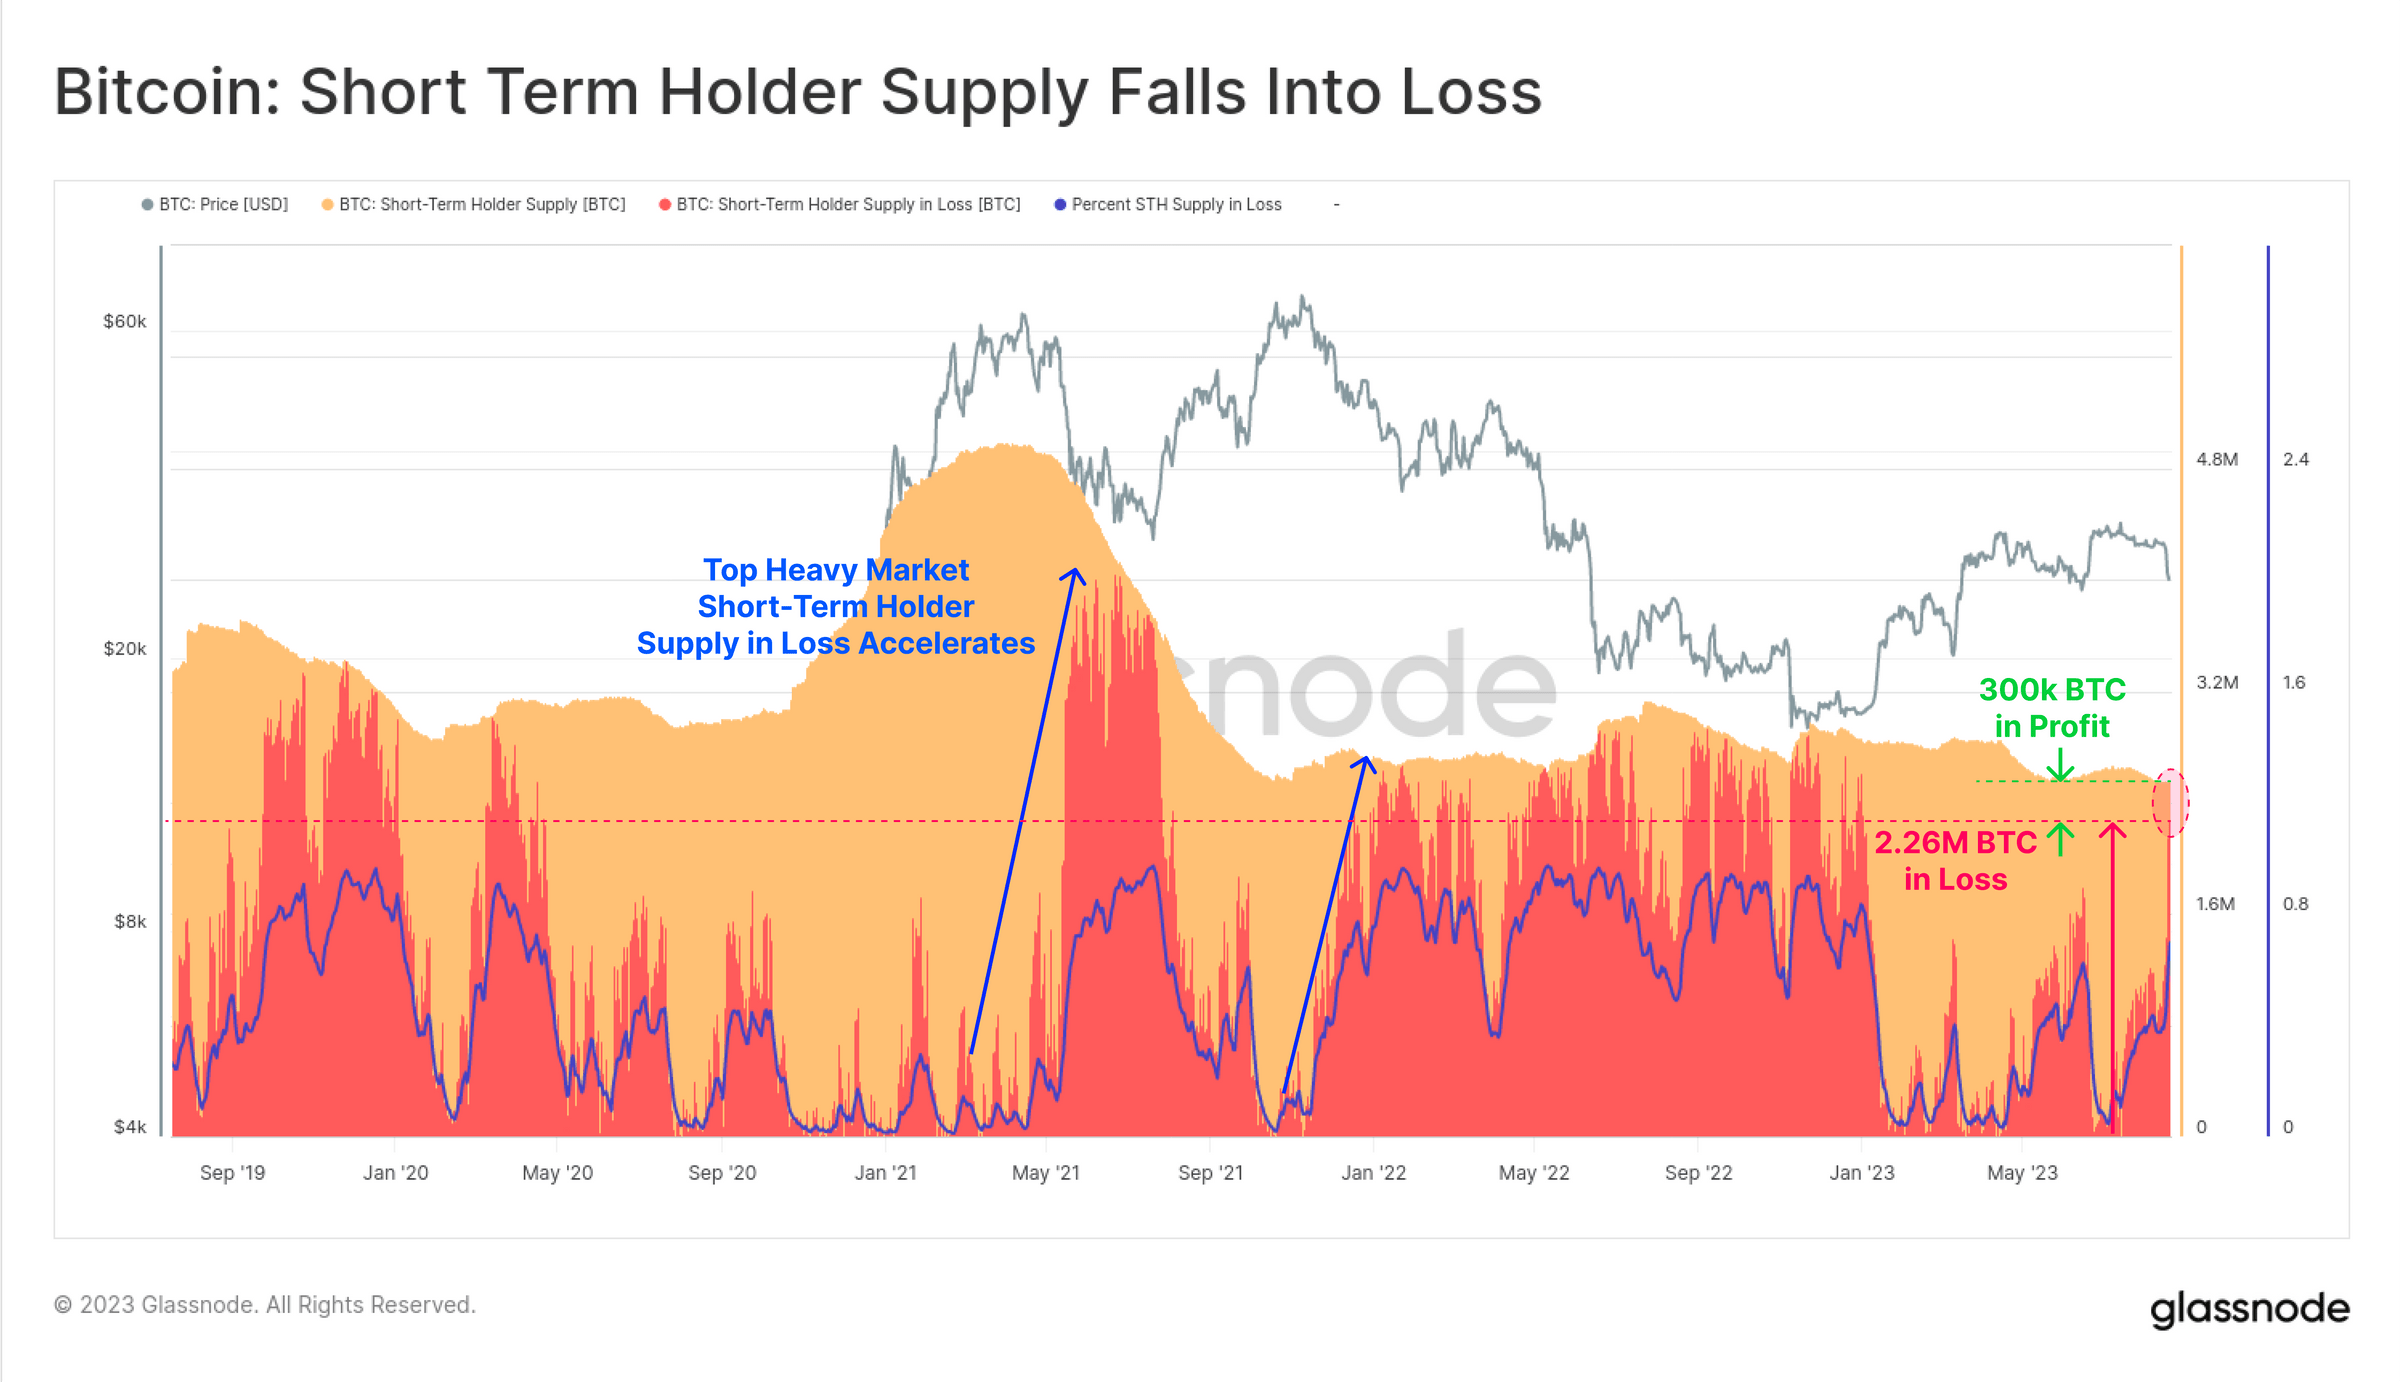
The fluctuating dynamics between profits and losses witnessed in the market can be further distilled through the Profit or Loss Bias (dominance) metric. As the 2023 rally unfolded, a discernible shift was noted in the STH cohort’s position: “This week we saw the largest loss dominance reading since the March sell-off to $19.8k. This suggests that the STH cohort are both largely underwater on their holdings, and increasingly price sensitive,” added Checkmate. An intriguing revelation comes from Glassnode’s experimental tool aimed at discerning market inflection points. With a meticulous design that maps macro trends of investors and the prevalence of profitability over losses (and vice versa), this tool offers a nuanced ‘Momentum indicator’. According to Checkmate, “We can see that after several months of declining profit dominance, Loss momentum and dominance have increased meaningfully.” Notably, while false positives have been recorded – as observed in the March 2023 correction – sustained declines have historically been precursors to sharper downtrends. Overall, the Bitcoin price crash on August 17 stands as the most significant single-day decline YTD. The sell-off was primarily a futures market leverage flush out, and is thus primarily a result of short-term positioning and market structure. However, the predominant sentiment is one of caution, largely because the most significant impact has been technical, specifically falling below long-term moving averages, a factor that could sway market sentiment. Long-Term Holders remain stoic, but the spotlight is on the Short-Term Holders. With an overwhelming 88.3% (equivalent to 2.26M BTC) of their supply at an unrealized loss, combined with an uptick in realized losses sent to exchanges and a breach of key technical support, the onus is on the bulls to defend their stance. Checkmate concludes:At press time, the Bitcoin price stood at $26,084.There is for sure potential for further downside momentum, but the majority of the damage is positioning and technical. The bull case is that realistically nothing has changed aside from the price, and the R/R still favors the upside. Calls for 12k are kidding themselves, but calls for 100K are as well.
Net Result == same as every pre-halving year ever.
Featured image from iStock, chart from TradingView.com
