Bitcoin price attempted to rise away from the $220 support level and the price recorded a high of $224.34 earlier today before trading sideways to $220 during the rest of the day.
By studying the 1 hour Bitfinex (BTC/USD) charts from (look at the below chart), we can understand today’s trading pattern. Bitcoin price increased from $220.73 to $224.34 before falling down again to test the $220 support level earlier today. The $220 support level reversed the bearish wave driving the price upwards again to over $223. At the time of the writing of this article, bitcoin price dropped below $220 to $218.53; however, we are likely to see the price rise up above the $220 support, and what we are seeing now can be nothing more than another “overshoot below support” behavior.

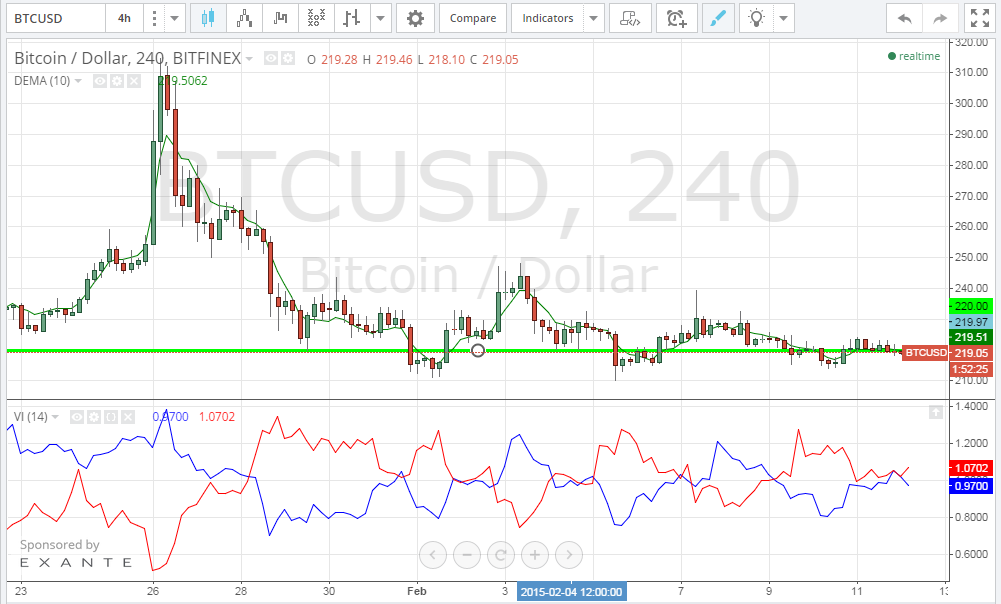
– Bitcoin price seems to be well supported above $220 since the 23rd of January.
– As concluded by the Vortex indicator, there are no signs of a bullish rally soon since the blue positive uptrend line has crossed below the red negative downtrend line. Also, the gap between the two lines is rising so it won’t be until some time that we can see the blue uptrend line cross above the red downtrend line ahead of a bullish wave.


Lol why do you use so many weird metaphors and catchphrases? Has anyone told you that you talk like a cheesy salesman?
It’s so obvious that you have no life just based on the words you used. Like anyone with regular interaction with real people will not talk the way you do. So painfully obvious that you are a closeted basement dweller without any connection with the outside except for raging fetishes for hating bitcoin, Mexicans, or whatever other weirdness you have going on. So ironic that you are talking about the real world. My god you are funny.