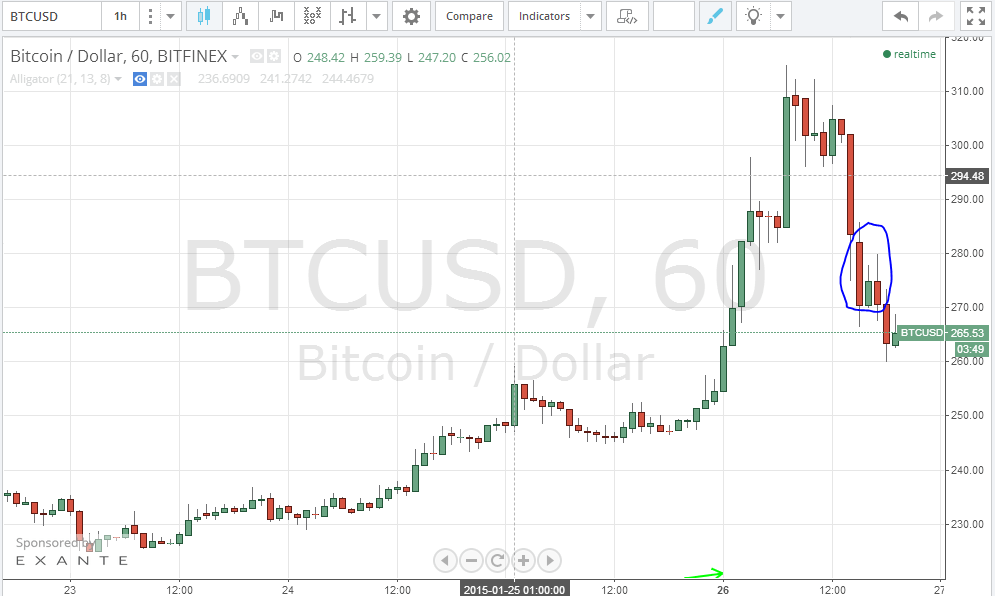
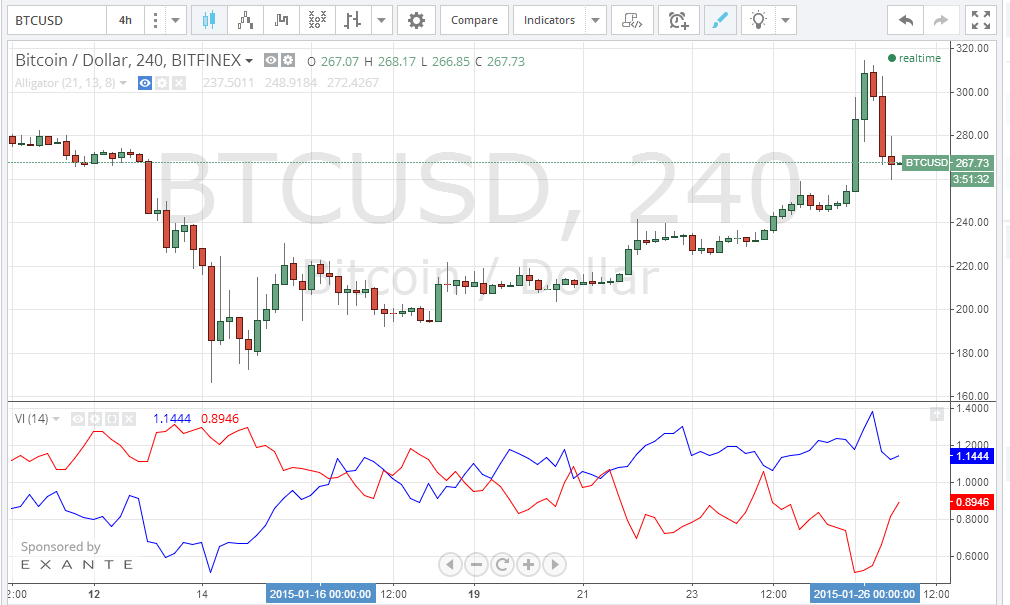
By observing the 1 hour Bitfinex BTC/USD charts from (look at the below chart), we can see how the price burst up to the $300 resistance line in a few hours, before declining again to around $263. This decline reflects the market’s attempt to correct the price as traders are selling to take their profits. By examining the 1 hour charts, we can spot many signals that denote that the bullish wave is still strong and is most probably going to continue. The 1 hour charts show a “stick sandwich” candle pattern (look at the 3 candles inside the blue cloud on the below chart), which means that the bearish wave that pulled the price down from $310 to around $264 is going to reverse during the next few hours.
Bitfinex Bitcoin Price Chart
Charts from Bitfinex.


Comments 2