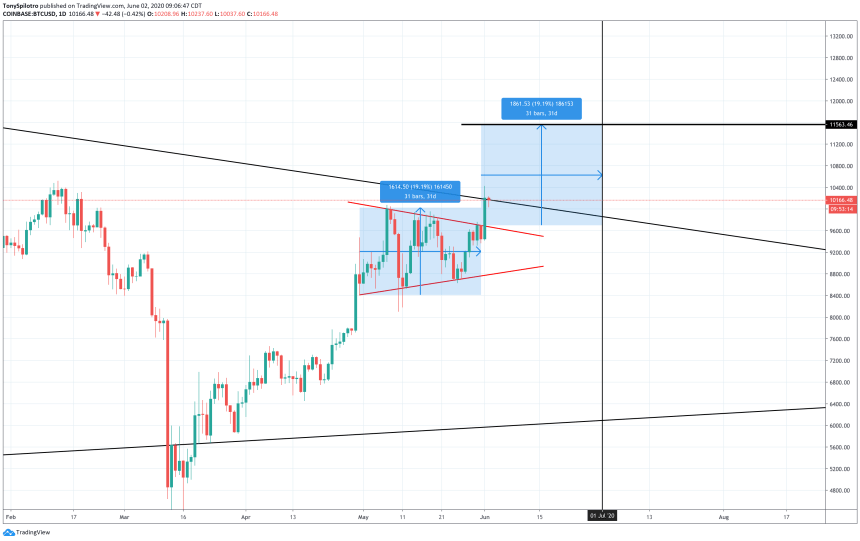
Last night ahead of an important daily close in the crypto market, Bitcoin broke up from a symmetrical triangle formation and closed the session price candle above the important resistance level of $10,000.
If Bitcoin can finally hold above this level and confirm the triangle as resistance turned support, the upside breakout technical target of the structure would bring the cryptocurrency to nearly $12,000.Bitcoin Breaks Out Of 30-Day Consolidation Within Symmetrical Triangle Chart Pattern
Bitcoin price is now trading above $10,150 after an over $600 green candle appeared just ahead of last night’s daily close. The surge caused altcoins to bleed out on BTC trading pairs, but on USD values saw a decent increase as well.
Recent developments around monetary policy, the increase in political tensions, and state of riots and looting that the United States has highlighted the importance of a digital store of value such as Bitcoin.
Related Reading | Bitcoin ‘Smart Money Indicator’ Revisits All-Time High, What’s Next?
Its use as a hedge against the coming inflation and the dollar itself weakening may be in part responsible for Bitcoin’s recent bullishness.Upside Technical Targets Targets Call For $11,500 to $12,500 BTC
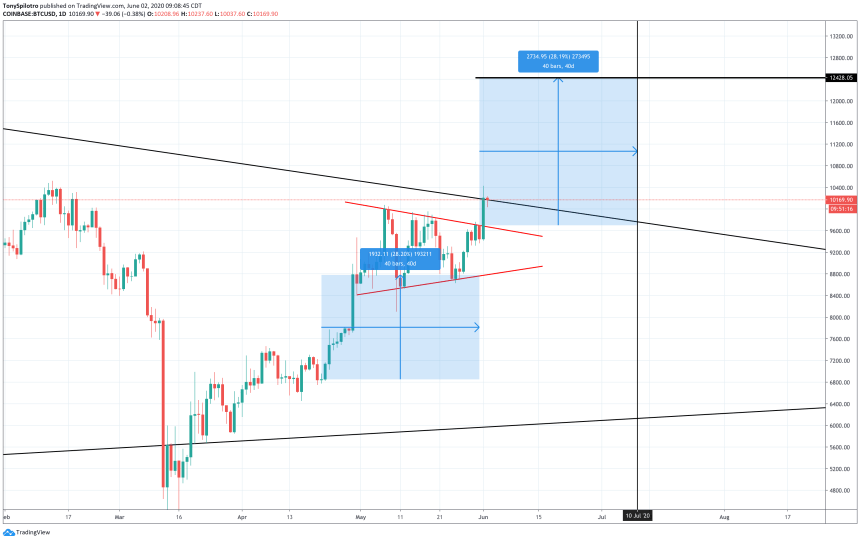
Last night, the crypto asset experienced a technical breakout of the symmetrical triangle chart pattern it had been trading within. According to the structure’s potential targets, Bitcoin price could between $11,500 and $12,500.


A measure of the flagpole would put Bitcoin price closer to $12,500. Interestingly, it took 40 days to break out from the initial flagpole. The same length of time would put BTC at that level on July 10.
Related Reading | Bitcoin Is Overpriced According Energy Value For First Time Since September 2019
July 10 would mark exactly one full year since the first-ever cryptocurrency traded at that price point to the day. Any further upside, however, is contingent upon resistance


