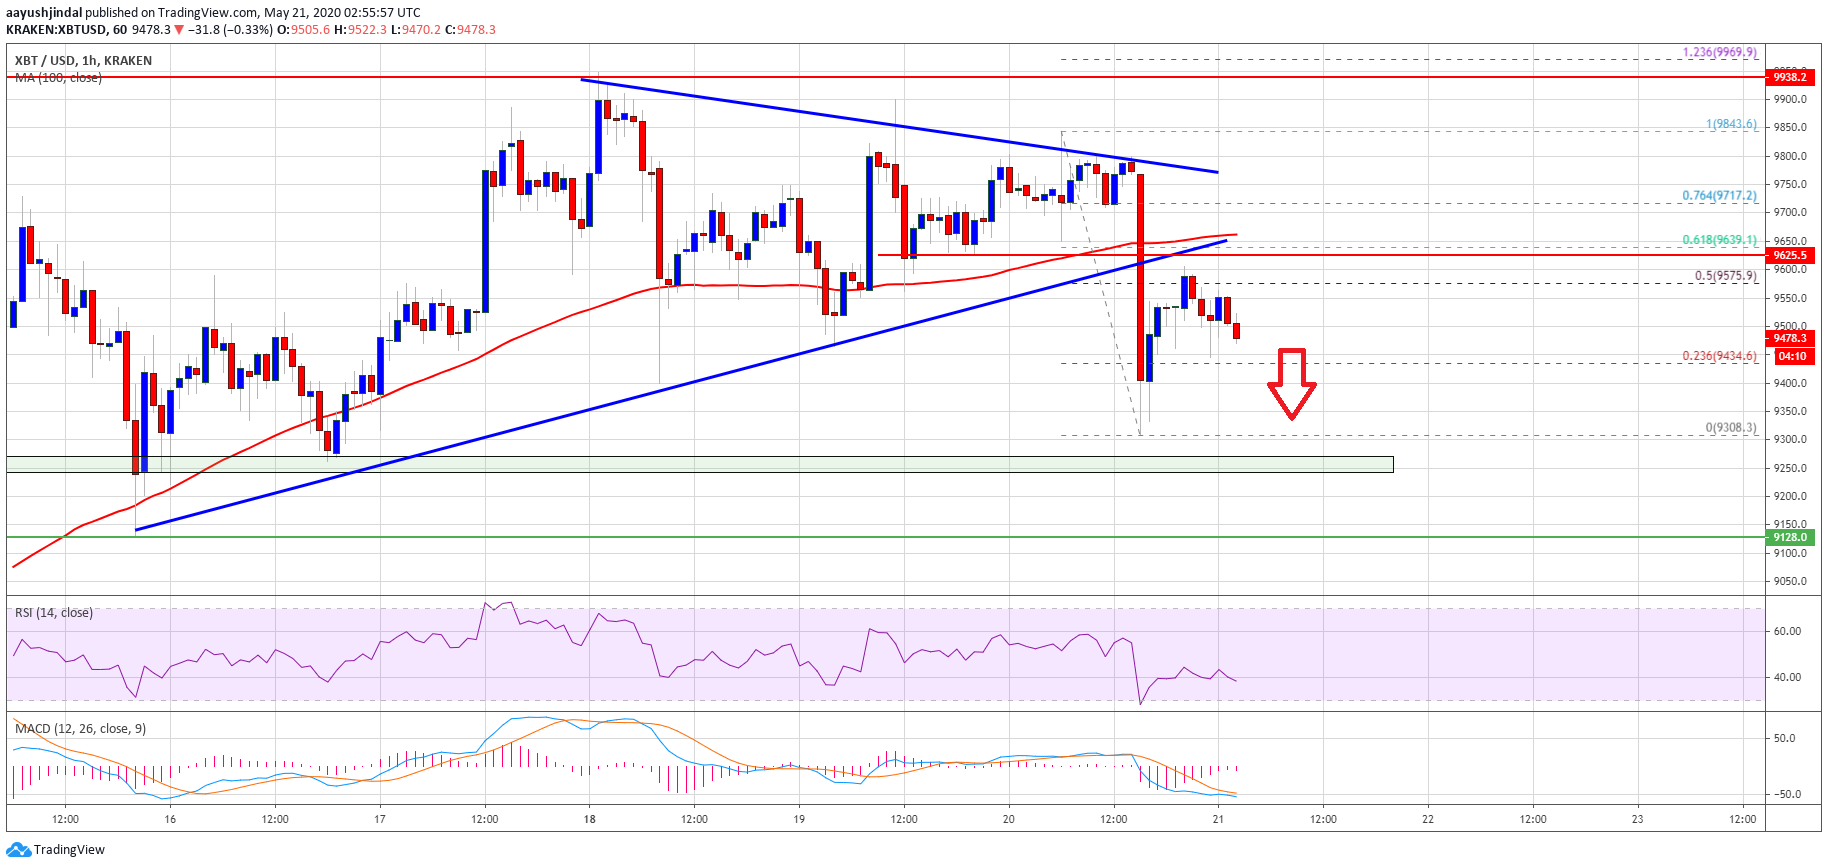
Bitcoin failed to climb above the $9,950 and $10,000 resistance levels against the US Dollar. BTC price is currently plunging and it is now vulnerable to more losses below $9,400.
- Bitcoin is down more than 3% from the weekly high and it is now showing bearish signs.
- The price is trading well below the $9,600 level and the 100 hourly simple moving average.
- There was a break below a major contracting triangle with support near $9,600 on the hourly chart of the BTC/USD pair (data feed from Kraken).
- The pair remains at a risk of more losses below the $9,400 and $9,250 levels.
Bitcoin Showing Bearish Signs
Bitcoin price started a bearish wave after it failed to continue above the $9,950 and $10,000 resistance levels against the US Dollar. BTC price is down more than 3% from the weekly high and it broke the $9,540 support zone.
The recent decline was such that the price even broke the $9,400 level and settled below the 100 hourly simple moving average. More importantly, there was a break below a major contracting triangle with support near $9,600 on the hourly of the BTC/USD pair.

A low is formed near $9,308 and bitcoin price is currently correcting higher. It tested the 50% Fib retracement level of the recent decline from the $9,843 high to $9,309 low.
It seems like the previous supports near $9,540 and $9,600 are now acting as hurdles. The first major hurdles is near the $9,640 level and the 100 hourly simple moving average. The 61.8% Fib retracement level of the recent decline from the $9,843 high to $9,309 low is also at $9,639.
To avoid more losses, BTC price must move back above the $9,540 and $9,640 resistance levels. The next key hurdles on the upside remain $9,950 and $10,000.
More Losses?
If bitcoin fails to recover above the $9,540 and $9,640 resistance levels, there are chances of more losses in the near term. An immediate support is near the $9,400 level.
The main support is near the $9,250 zone (the last key pivot zone). If the bulls fail to defend the $9,250 support level, the price could continue to move down towards the $9,120 and $9,000 levels in the near term.
Technical indicators:
Hourly MACD – The MACD is slowly reducing its bearish slope, but there are many negative signs visible.
Hourly RSI (Relative Strength Index) – The RSI for BTC/USD is sliding and it is well below the 50 level.
Major Support Levels – $9,400 followed by $9,250.
Major Resistance Levels – $9,640, $9,800 and $9,950.


