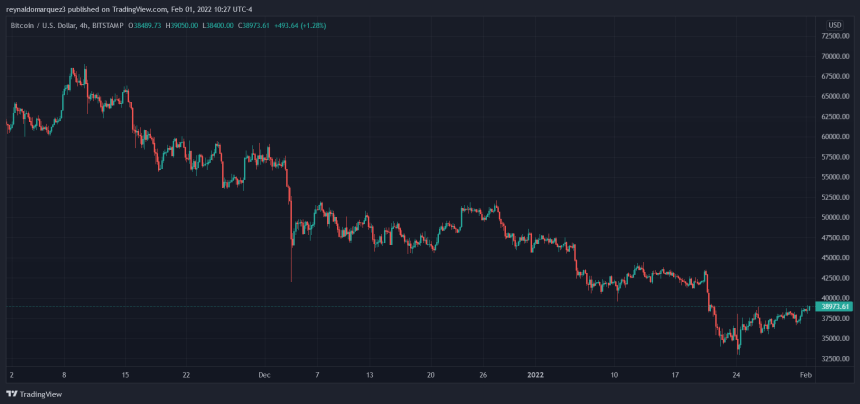
Bitcoin has seen more greens in the last day as it climbs its way back above $39,000. As of press time, BTC’s price was rejected at those levels, but the bulls are showing some conviction and could push further into previous highs.
Related Reading | TA: Bitcoin Near Crucial Juncture: Why BTC Could Surge Further
The first crypto by market cap, at the time of writing, is exchanging hands at a price of $38,654 with a 4.2% profit in 24-hours.

In the short term, bulls seem to have the upper hand as market conditions are favorable of a short squeeze. As NewsBTC reported yesterday, the macro-economic factors pushing down Bitcoin will abate for the coming weeks potentially aiding a relief rally into mid-March.
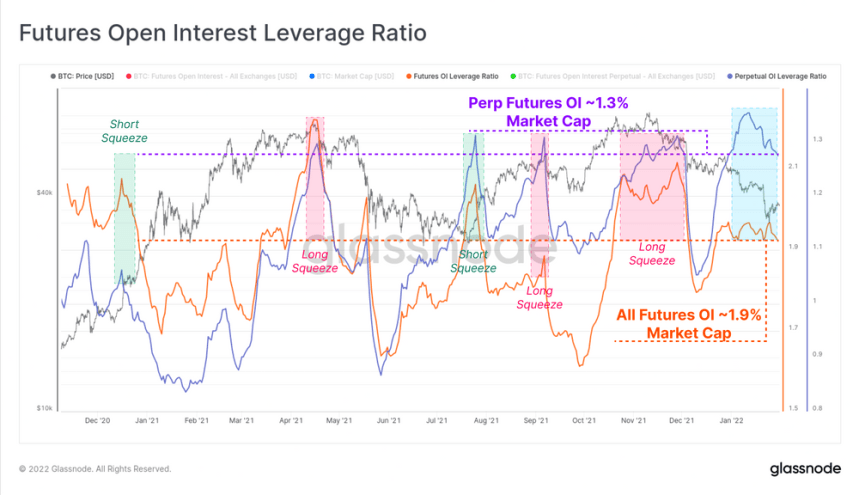
In a recent report, Glassnode identifies a shift in bias from market participants from a majority of long positions during Q4, 2021, to mostly short in January 2022. Despite the recent downtrend, the Open Interest (OI) across the Futures sectors has increased and sits at a nearly two-year high.
Glassnode claims the Futures sector has been seeing a decrease in its trading volume since 2021 standing close to $60 billion a day as Bitcoin reached the low $30,000s. In the meantime, OI records a 1.3% of BTC total market cap which could suggest a deleveraging event is in the making.
In other words, whenever Bitcoin reaches an OI above 1% of its total market cap, BTC’s price is quickly propelled into either direction. As seen below, BTC could either experience a long or short squeeze, but the latter seems more likely due to the shift in traders’ bias. Glassnode :
With high negativity, elevated leverage, and an overall short bias, a reasonable argument could be made for a potential counter-trend short squeeze in the near-term.

Bitcoin Heading To $30K? Volatility Incoming
In high timeframes, Bitcoin’s revisit of previous highs around $40,000 could be short-lived as the market expects the U.S. Federal Reserve (FED) to hike their interest rates by March 17th. Around those times, the crypto market could see more downside back to the low $30,000s or below these levels.
Related Reading | TA: Ethereum Rallies 10%: Why More Gains Seem Possible
Data from Material Indicators (MI) records a slight change in Options flows with a lot of sold puts for BTC at $25,000 by the end of February. This could suggest BTC would find a solid bottom above these levels, in case of further downside as market participants are getting of their option positions below them. MI :
Last time (July, 2021) we tagged all bearish order flow levels. It’s only 1 observation, but that would put us at 30k daily close before we reverse if it were to happen again. Not sure if we’ll see a repeat.


