Darkcoin price increased throughout yesterday’s trading sessions from a low of 0.01189 BTC to around 0.01300 BTC on Cryptsy. If the current bullish wave continues on, we can see darkcoin price rise to test the 78.6% Fibonacci retracement level within a few days
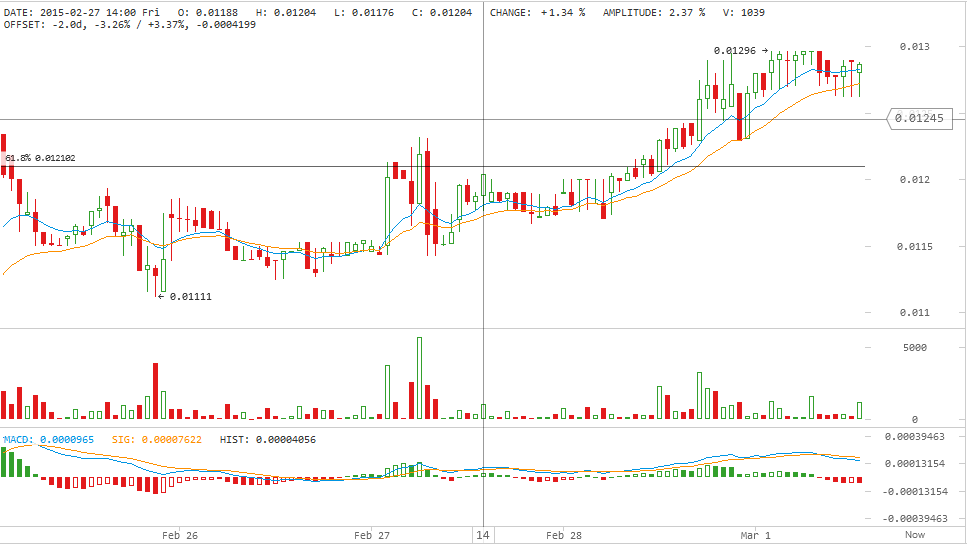
By studying the 1 hour Cryptsy (DRK/BTC) chart from and plotting the 10 hour EMA (green curve) and the 20 hour EMA (orange curve) (look at the below chart), we can conclude the following:
- DRK price is currently higher than the 10 hour and the 20 hour EMAs which reflects the current bullish trend of the market, so we can see the price rise to test the 0.014 BTC resistance level within the next 48 hours or so.
- The long downwards shadows of the candlesticks on the 1 hour charts reflect the strong buying power of the market at the moment. On the other hand, we cannot see long upwards shadows so the price is likely to continue rising.
- Today’s trading volume is relatively lower than yesterday’s which may delay a rise in DRK price a few hours until trading volume is enough to maintain the upwards momentum.
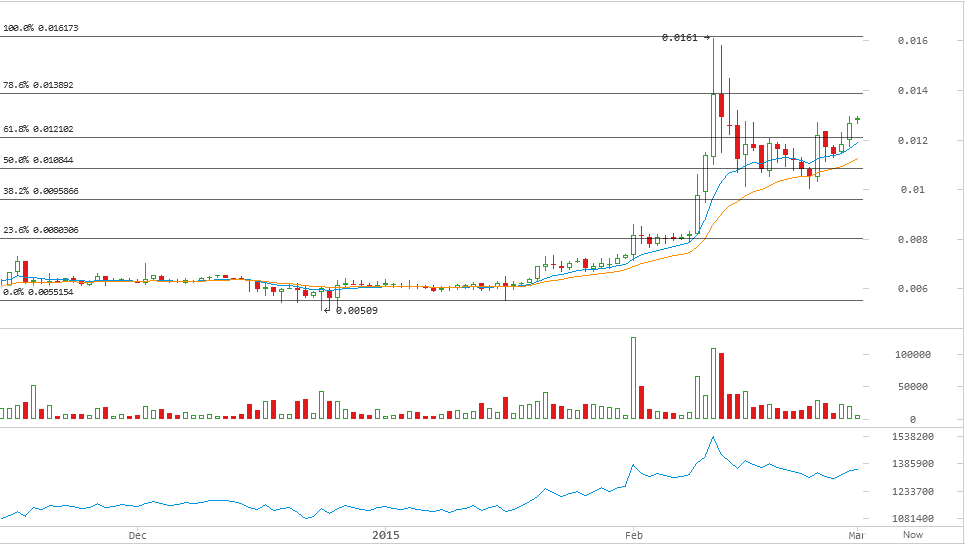
By studying the 1 day Cryptsy (DRK/BTC) chart from bitcoinwisdom.com and plotting the On-Balance Volume (OBV) oscillator, we can conclude the following:
- A new bullish trend started on the 24th of February and pushed the price past the resistance level at 0.012102 BTC and will continue pushing the price up to attempt testing the 78.6% Fibonacci retracement level at 0.013892 BTC.
- The OBV is now sloping in an upwards direction which reflects the strength of the market’s buying volume which is in favor of continuation of the current bullish trend.
Conclusion:
Darkcoin price continued rising yesterday to record a high of 0.01300 BTC. Our technical analysis predicts continuation of the current bullish wave so that we can see DRK price test the 0.013892 BTC resistance level during the next 48 hours.
Charts from Cryptsy


