Dogecoin Could Peak Above $1 In 2025
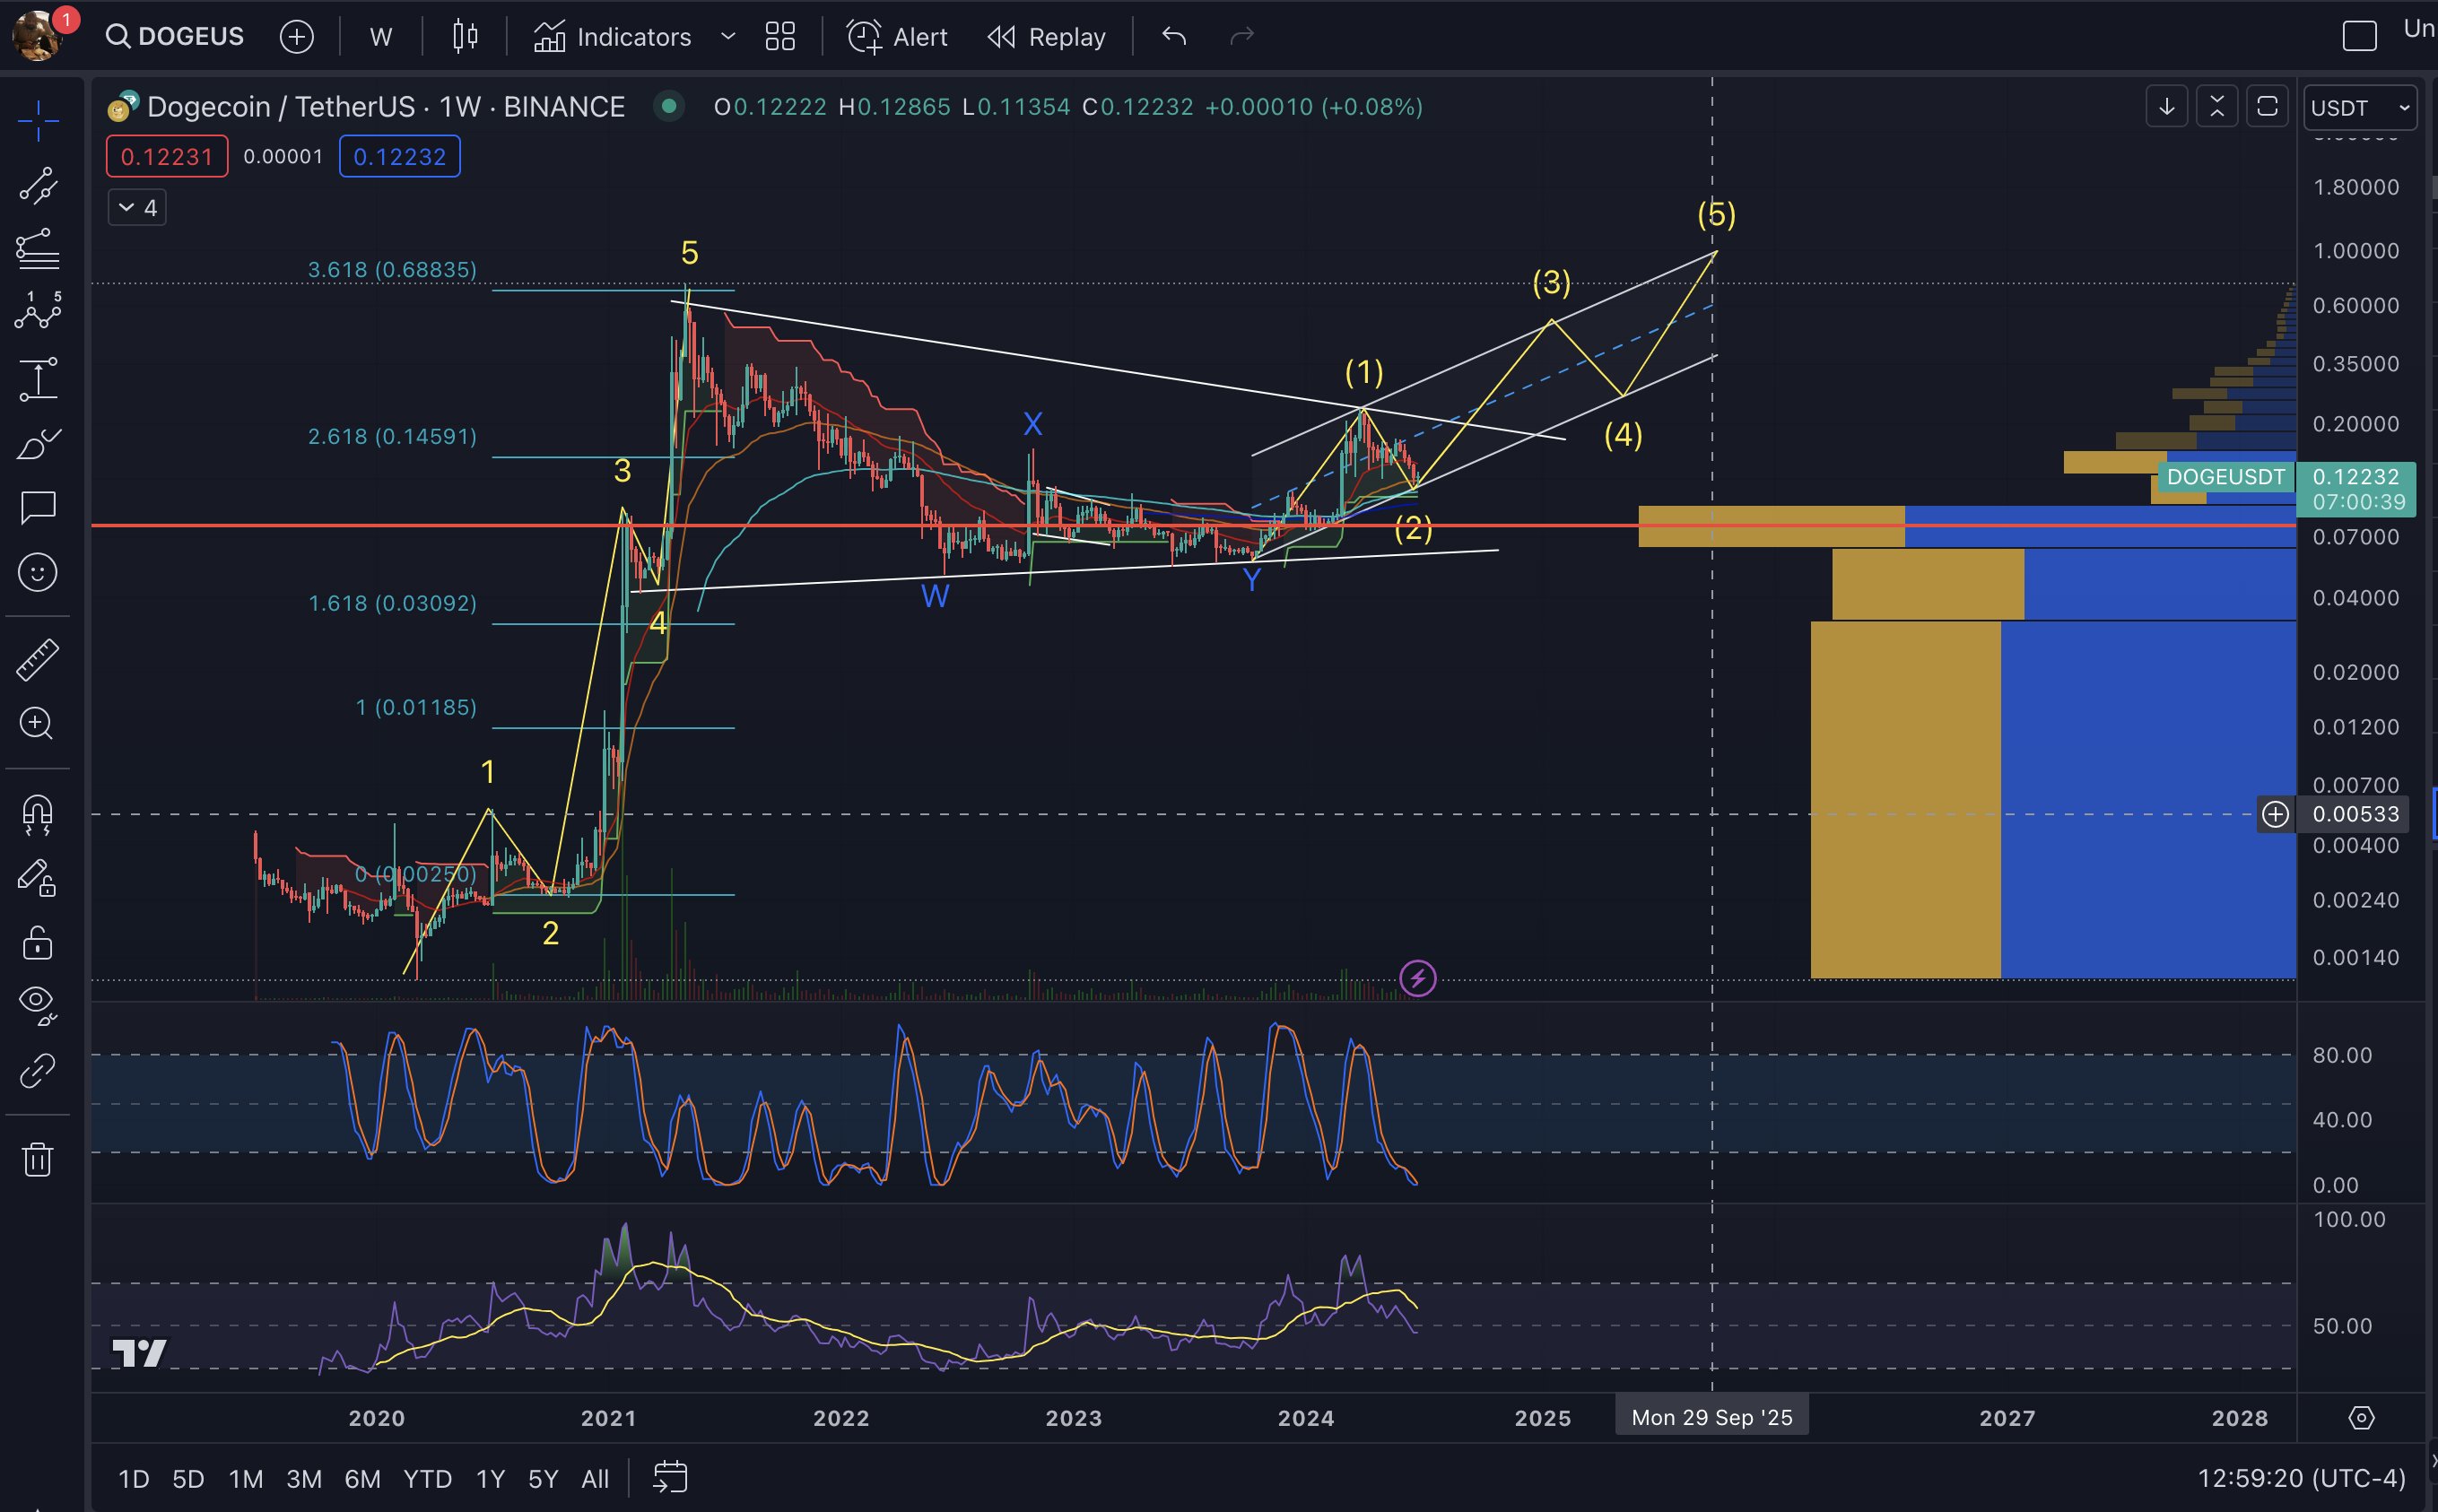
The weekly chart (DOGE/USDT) highlights Dogecoin’s previous market performance, where it completed a 5-wave Elliott Wave pattern during the last significant bull run. This pattern saw the price of Dogecoin escalate to just above $0.70.
Since late 2023, according to Big Mike’s analysis, Dogecoin has embarked on a new 5-wave pattern. This nascent formation is anticipated to drive the Dogecoin price significantly higher than its previous highs. The first wave propelled the DOGE price to a peak just shy of $0.23. Following this, the second wave commenced, resulting in a retracement that pulled the price down to as low as $0.1140.
The analysis indicates that Dogecoin is currently in the initial stages of the third wave of this Elliott Wave pattern. Traditionally, the third wave is the most dynamic and typically extends the furthest, especially within a strong bullish context.Notably, Big Mike highlights the existence of an ascending channel starting from the onset of wave 1 further corroborates the bullish sentiment maintained in this analysis. This channel maps out the potential pathway that Dogecoin might follow as it aims for new highs. The wave 3 could peak at the upper trendline of the channel, at around $0.60.
The chart carefully marks critical Fibonacci extension levels which are drawn from the beginning to the peak of the last bull run. that are expected to play pivotal roles in determining future price points during this bull run. The first notable Fibonacci extension at 2.618 is positioned at approximately $0.14591, serving as an intermediate station within the bull cycle. The 3.618 extension at $0.68835 serves as an intermediary target for the final fifth wave.
The Volume Profile Visible Range (VPVR) on the chart reveals that the current price zone has a high concentration of traded volume, suggesting it acts as a robust foundation for the current price level. The absence of significant volume above this area hints at minimal resistance, which could allow for an accelerated price climb once Dogecoin breaks above existing resistance levels.


