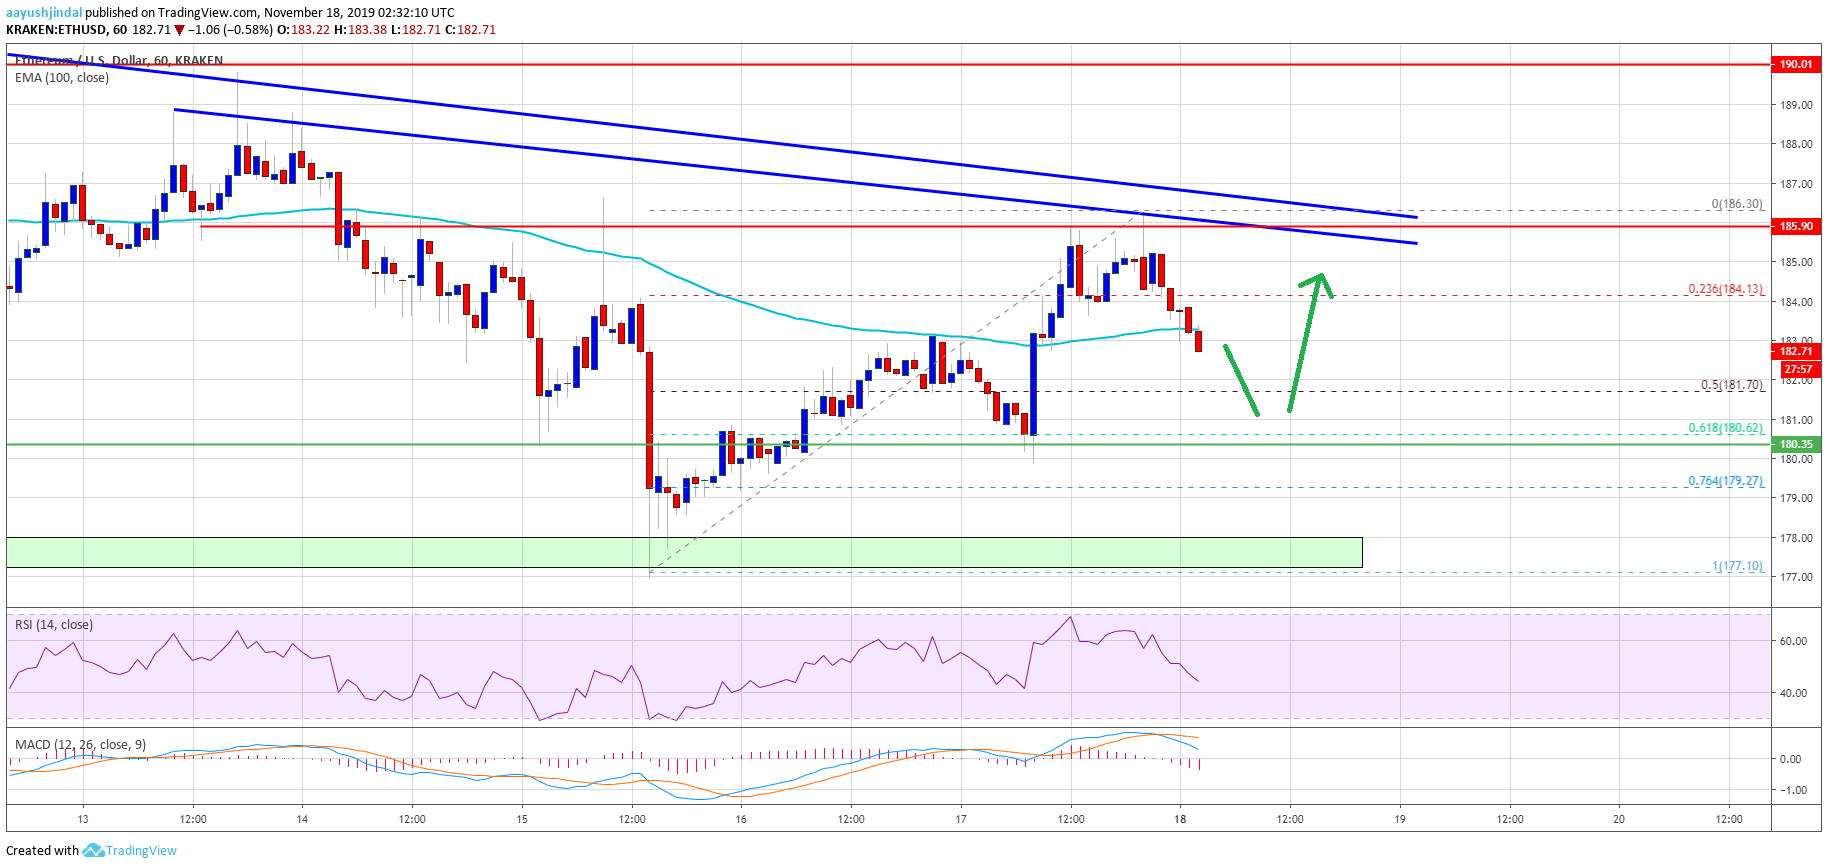
- Ethereum price is still struggling to climb above $186, $188 and $190 resistances against the US Dollar.
- The price is currently declining and it seems like it could retest the $180 support area.
- There are two major bearish trend lines forming with resistance near $186 on the hourly chart of ETH/USD (data feed via Kraken).
- Bitcoin is under a lot of pressure and it recently decline below the $8,500 support.
Ethereum price is holding an important support versus the US Dollar, while climbing vs bitcoin. ETH price might retest the $180 or $178 support area in the near term.
Ethereum Price Analysis
Recently, Ethereum found a strong buying interest near the $178 level against the US Dollar. As a result, ETH price started an upward move above the $180 and $182 levels. Moreover, the price broke the $185 resistance and the 100 hourly simple moving average. However, the upward move was capped by the $186 resistance area. A high was formed near $186 and the price is currently correcting lower.On the upside, Ethereum price is still struggling to climb above $186, $188 and $190 resistances. More importantly, there are two major bearish trend lines forming with resistance near $186 on the hourly chart of ETH/USD.

ETH Technical Indicators
Hourly MACD – The MACD for ETH/USD is slowly gaining pace in the bearish zone.
Hourly RSI – The RSI for ETH/USD is currently gaining bearish momentum and is well below the 50 level.
Major Support Level – $180 Major Resistance Level – $186


