- ETH price extended losses and traded below the $170 support level against the US Dollar.
- Sellers gained momentum and pushed the price towards the $160 support level.
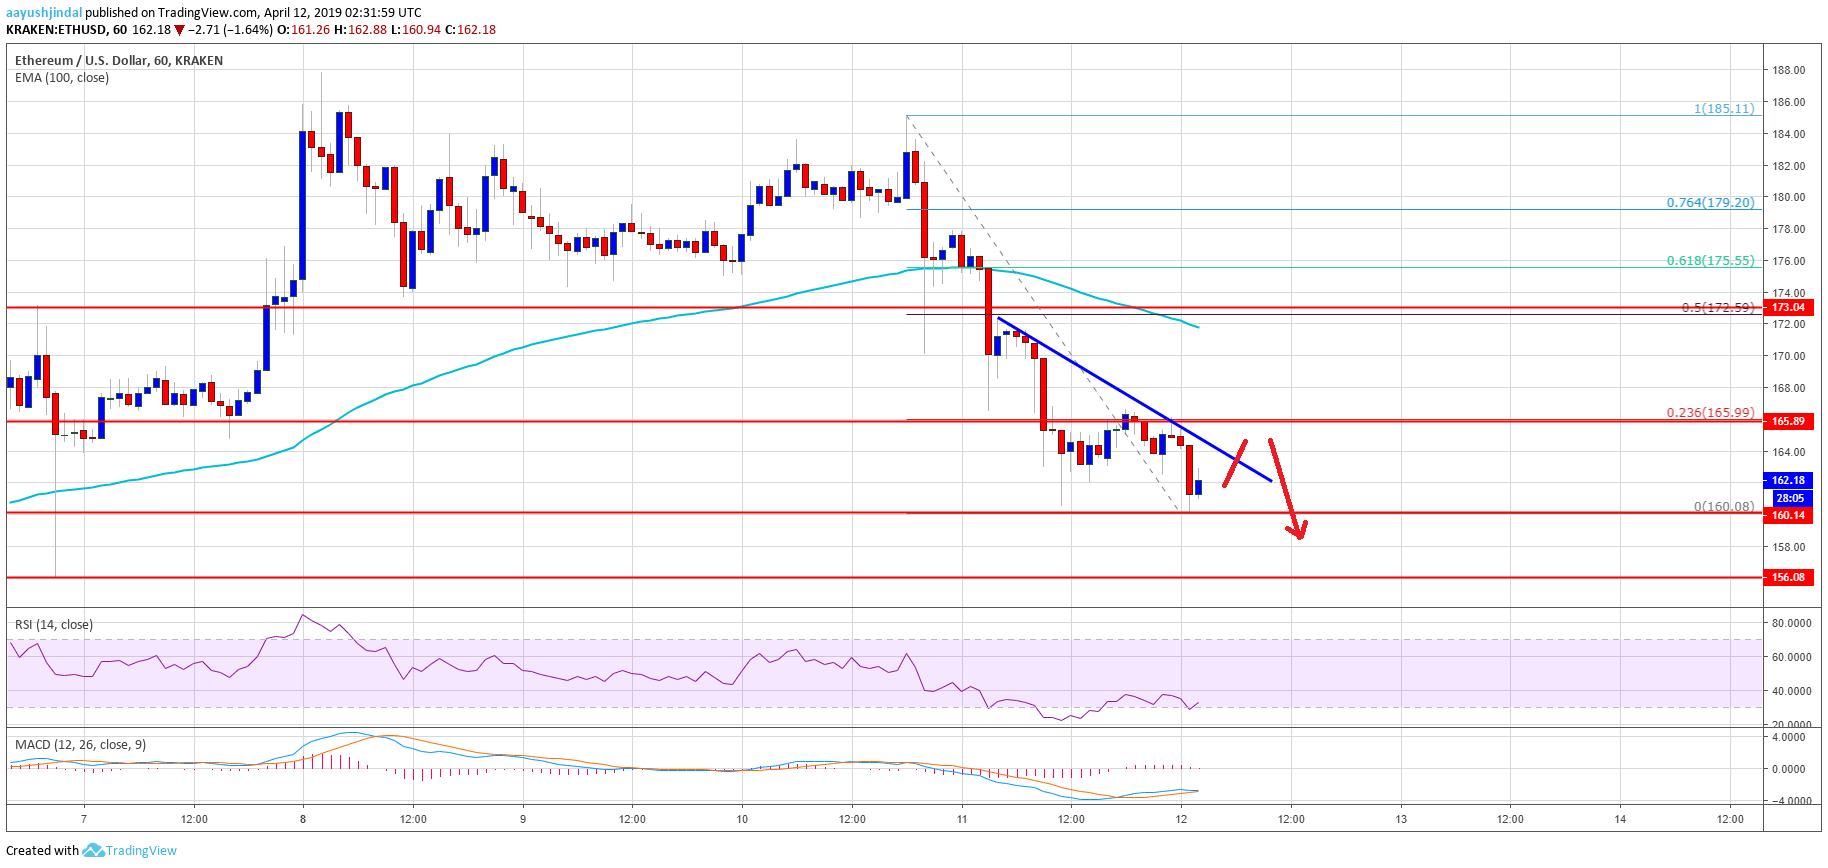
- There is a key bearish trend line in place with resistance at $164 on the hourly chart of ETH/USD (data feed via Kraken).
- The pair could continue to move down and it is likely to test the key $155 support area in the near term.
Ethereum price struggled recently and declined heavily versus the US Dollar and bitcoin. ETH is likely to test the key $155 support level, where buyers are likely to appear.
Ethereum Price Analysis
After struggling near the $185 resistance, Ethereum price started a downside correction against the US Dollar. The ETH/USD pair gained bearish momentum and broke the $175 and $170 support levels. Recently, there was an increase in selling pressure and the price broke the $165 support and the 100 hourly simple moving average. It resulted in additional losses and the price moved toward the $160 support area. It is currently consolidating losses above $160, with a bearish angle.
On the upside, an initial resistance is near the $164 level and the 23.6% Fib retracement level of the last slide from the $185 high to $160 low. There is also a key bearish trend line in place with resistance at $164 on the hourly chart of ETH/USD. The $165 level is also a significant resistance since it was a support earlier. If there is a break above the $165 level, the price could rebound towards the $172 level. It represents the 50% Fib retracement level of the last slide from the $185 high to $160 low. Besides, the 100 hourly SMA is also near the $172 level.
ETH Technical Indicators
Hourly MACD – The MACD for ETH/USD is slowly moving in the bearish zone.
Hourly RSI – The RSI for ETH/USD is now well below the 50 level and it is currently near 32.
Major Support Level – $155


