
- ETH price made a few attempts to settle above the $300 resistance area against the US Dollar.
- It is currently consolidating near $300 and it might rise above $305 and $306 in the near term.
- There is a new connecting bullish trend line forming with support near $297 on the hourly chart of ETH/USD (data feed via Kraken).
- If there is a downside break below $295, the price could revisit the $285 support area.
Ethereum price is showing positive signs above $295 versus the US Dollar, but struggling vs bitcoin. ETH price might accelerate gains once it settles above the $300 and $305 levels.
Ethereum Price Analysis
There were extended gains in bitcoin above the $11,500 level, but Ethereum struggled against the US Dollar. Earlier, the ETH/USD pair made a few attempts to settle above the $300 resistance area. Finally, there was an upside break, but there was no momentum above the $300 level. The price traded to a new intraday high near $304 and settled above the 100 hourly simple moving average.
It is currently correcting gains and is trading near the $300 level. The 23.6% Fib retracement level of the recent wave from the $290 swing low to $304 high is also near the $300 level. If there are more downsides, the price might test the $296-297 support area. Moreover, there is a new connecting bullish trend line forming with support near $297 on the hourly chart of ETH/USD.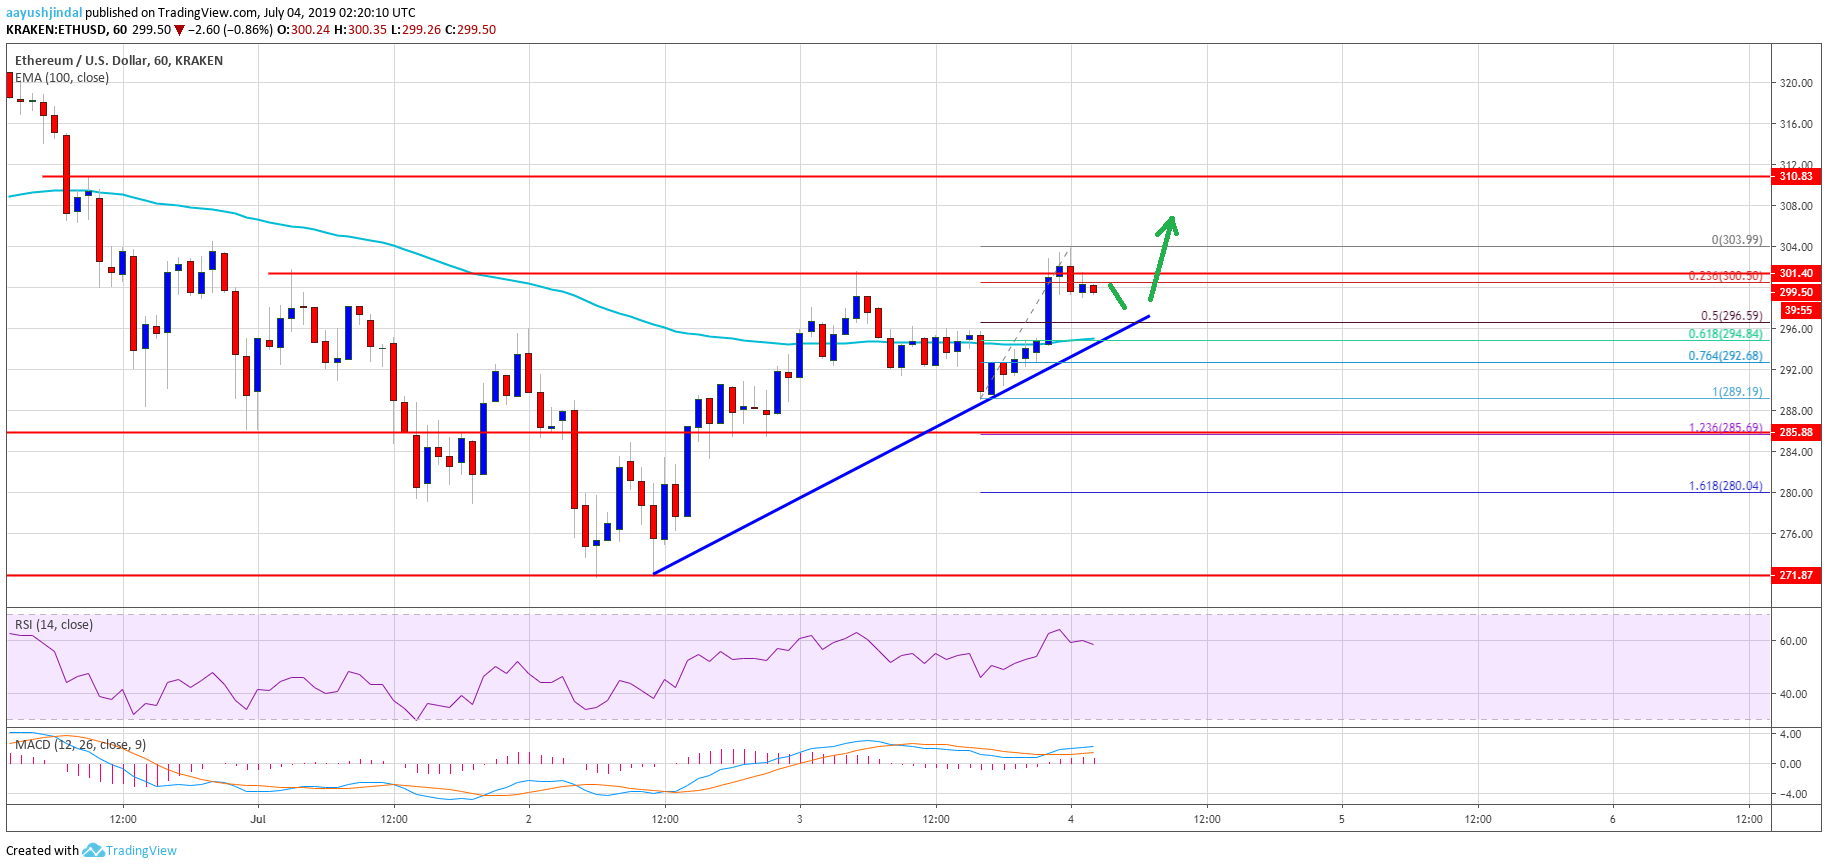
ETH Technical Indicators
Hourly MACD – The MACD for ETH/USD is currently showing positive signs in the bullish zone.
Hourly RSI – The RSI for ETH/USD is currently well above the 50 level, but it is correcting lower.


