
- ETH price broke a few important resistance levels near the $134 level against the US Dollar.
- The price gained traction and settled above the $134 and $136 resistance levels.
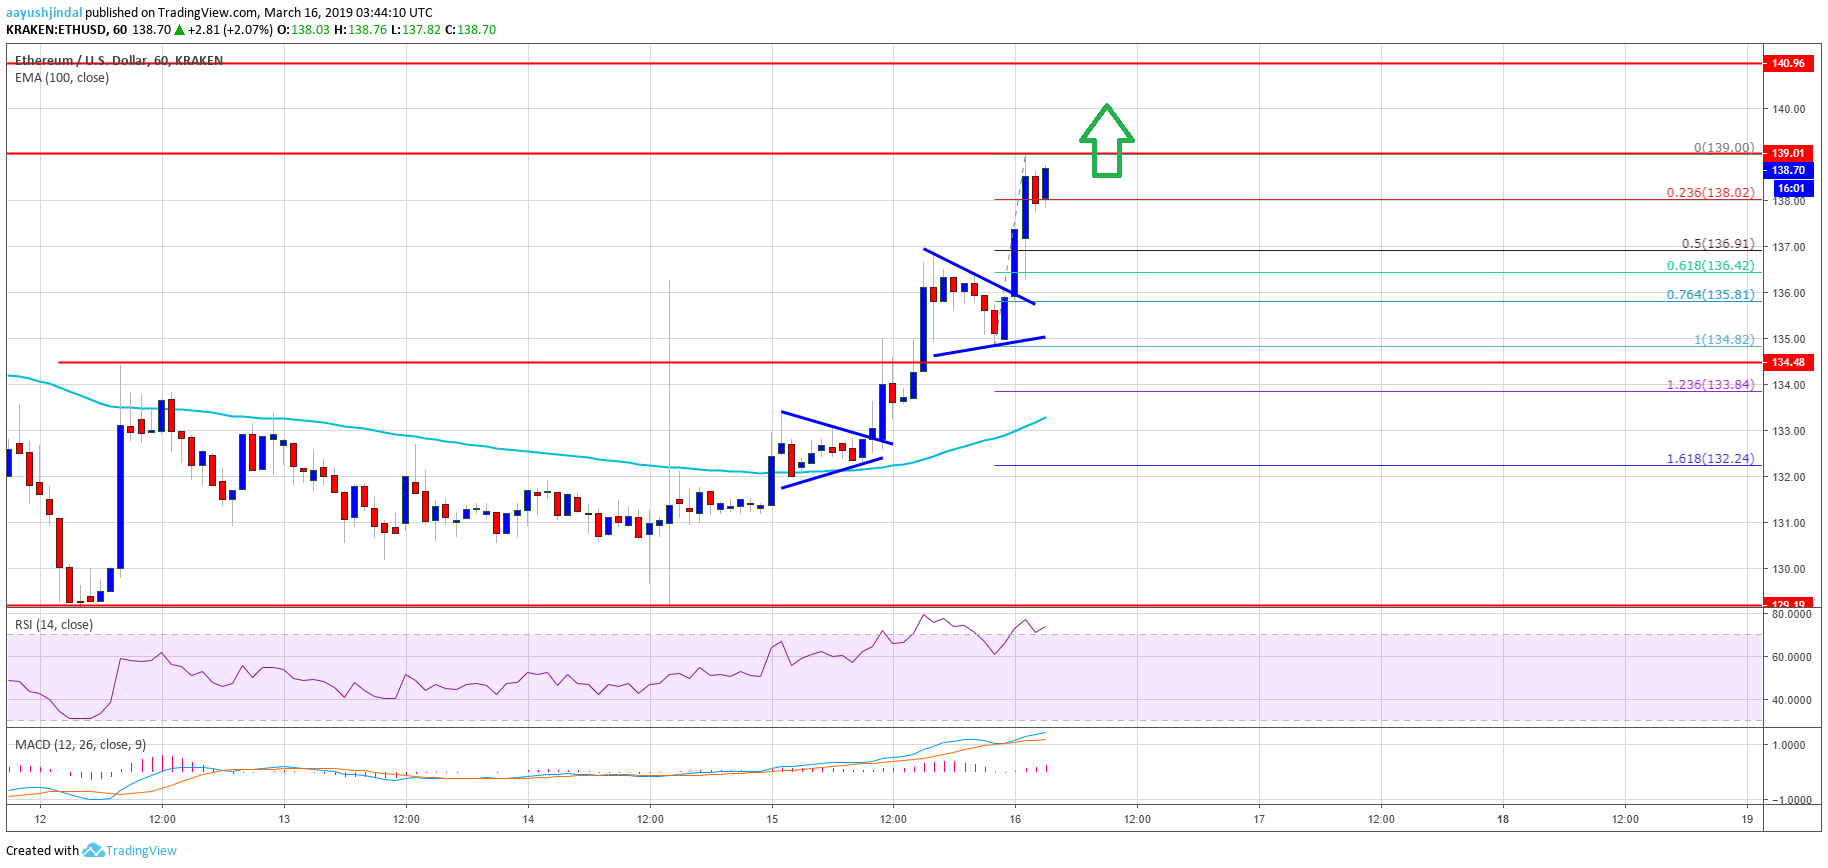
- This was a break above a few continuation patterns near $133 and $136 on the hourly chart of ETH/USD (data feed via Kraken).
- The pair is currently trading near the $139 resistance and it could continue to trade higher in the near term.
Ethereum price is gaining bullish momentum against the US Dollar and bitcoin. ETH is likely to break the $139, $144 and $146 resistance levels to move into a positive zone.
Ethereum Price Analysis
Yesterday, we discussed that ETH price remains supported for more upsides towards the $135, $137 and $140 levels against the US Dollar. The ETH/USD pair formed a solid support near the $133 level and later started an upside move. It broke the $134 resistance and settled above the 100 hourly simple moving average. It opened the doors for more gains and the price traded above the $135 and $137 resistance levels.During the rise, there was a break above a few continuation patterns near $133 and $136 on the hourly chart of ETH/USD. The pair even broke the $138 resistance and tested the $139 hurdle. Recently, there was minor dip after the price tested the $139 resistance. It tested the 23.6% Fib retracement level of the recent leg from the $135 swing low to $139 high. However, the price remains well supported and downsides are likely to be contained by the $138 support.
ETH Technical Indicators
Hourly MACD – The MACD for ETH/USD is showing positive signs in the bullish zone.
Hourly RSI – The RSI for ETH/USD is now placed well above the 60 level, with a strong bullish angle.
Major Support Level – $137


