
- ETH price traded to a new monthly low near $190 and later corrected lower against the US Dollar.
- The price corrected above the $200 resistance level, but upsides could face hurdles near $220 and $225.
- There is a crucial bearish trend line forming with resistance near $218 on the hourly chart of ETH/USD (data feed via Kraken).
- The pair could struggle to gain momentum above the $218, $220 and $225 resistance levels.
Ethereum price is currently correcting losses above $200 versus the US Dollar, similar to bitcoin. ETH price might start a fresh decrease if it fails to continue higher above $225.
Ethereum Price Analysis
Yesterday, we saw a sharp decline in bitcoin and Ethereum price against the US Dollar. ETH/USD even broke the key $200 support level and traded to a new monthly low. A swing low was formed near $190 and recently the price started an upside correction. It broke the $200 resistance to start a decent recovery. Moreover, there was a break above the $210 resistance plus the 50% Fib retracement level of the last decline from the $235 high to $190 low.
However, the price faced a strong resistance near the $218 and $220 levels. Moreover, there is a crucial bearish trend line forming with resistance near $218 on the hourly chart of ETH/USD. It seems like the pair struggled near the 61.8% Fib retracement level of the last decline from the $235 high to $190 low. Above the trend line, the next important resistance is near the $225 level.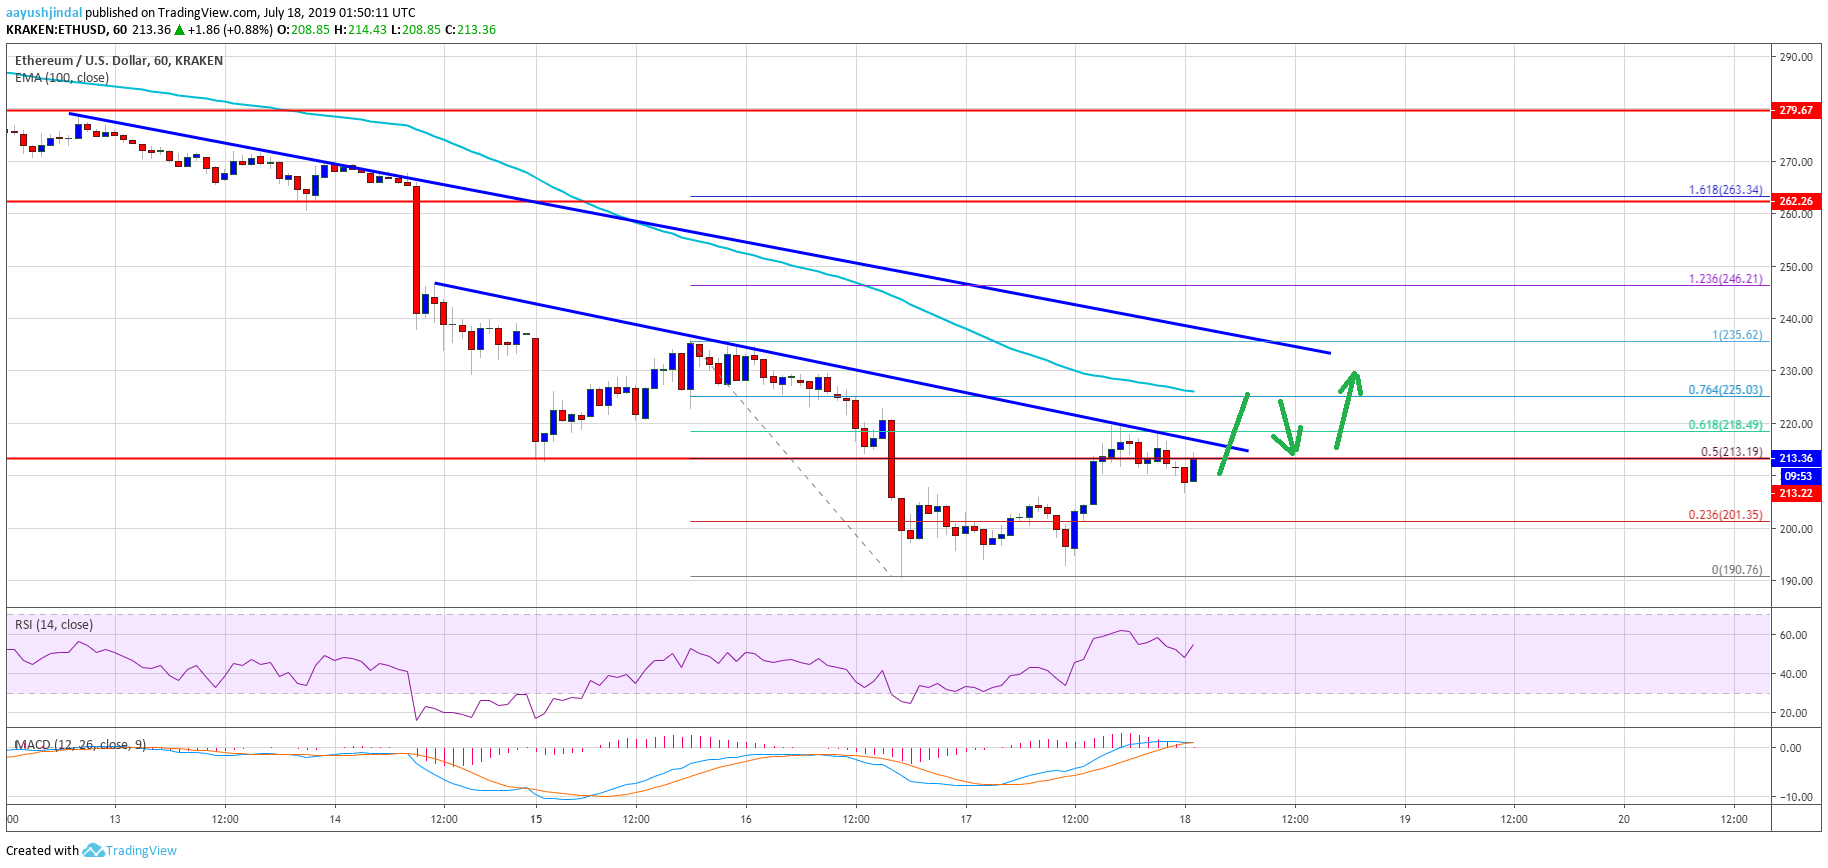
ETH Technical Indicators
Hourly MACD – The MACD for ETH/USD might move back into the bearish zone.
Hourly RSI – The RSI for ETH/USD is currently above the 50 level, with a bullish angle.


