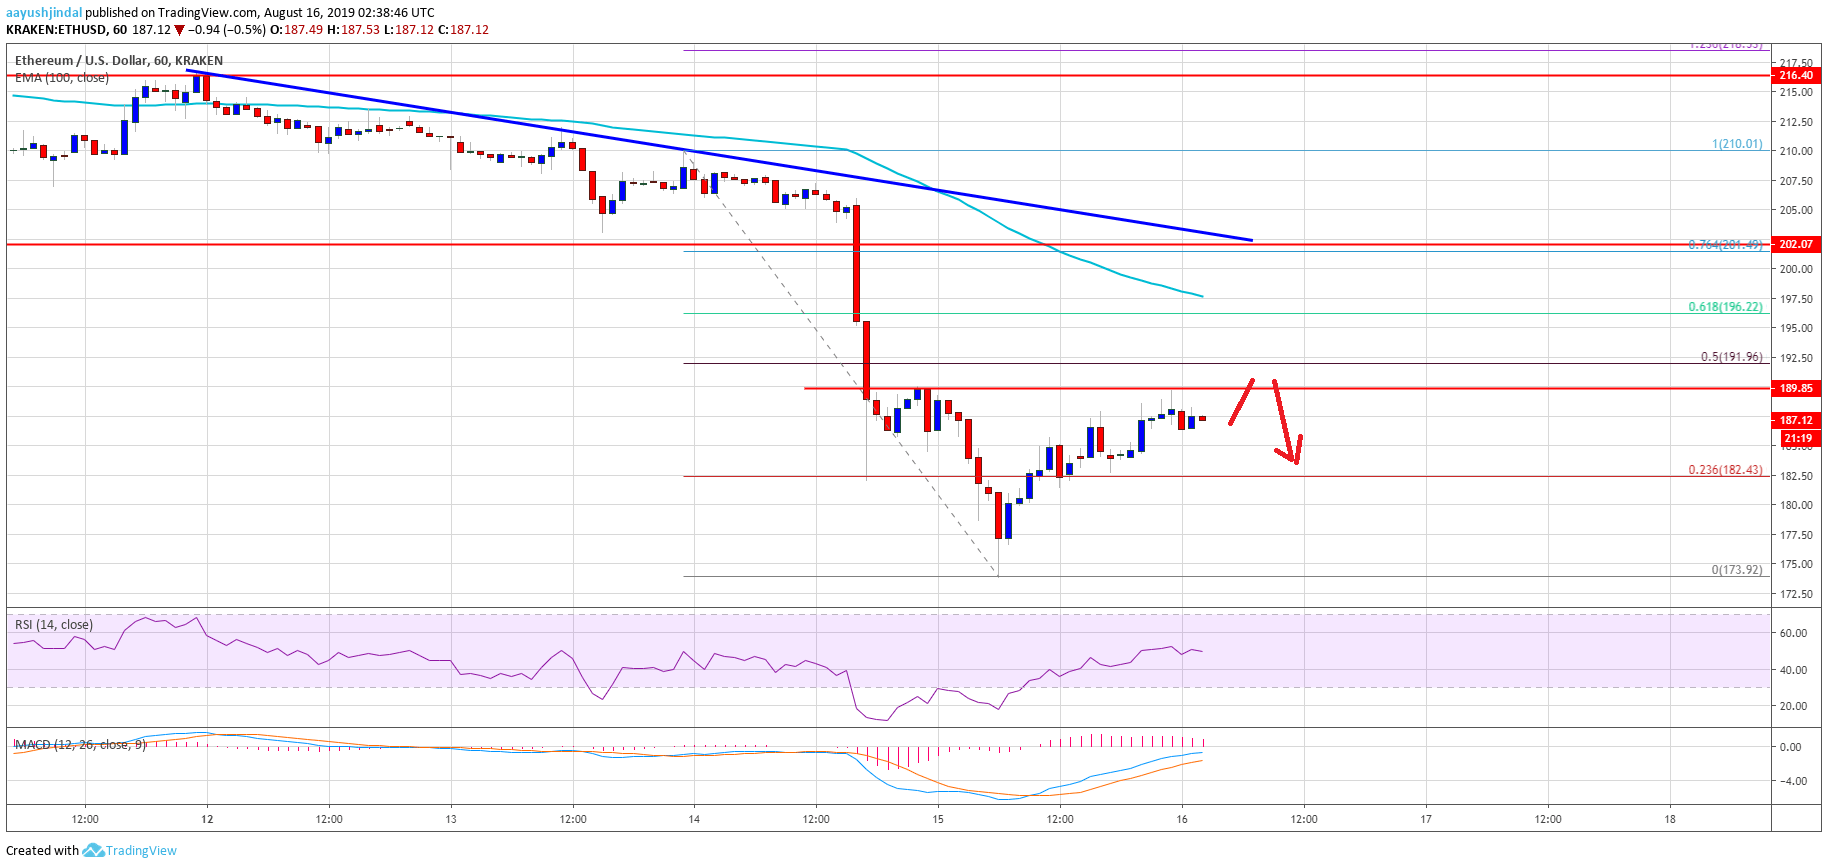
- ETH price declined to a new monthly low at $173 and recently recovered against the US Dollar.
- There was a break above the $180 and $182 resistance levels.
- This week’s followed major bearish trend line is in place with resistance near $202 on the hourly chart of ETH/USD (data feed via Kraken).
- The pair is likely to face a strong resistance near the $190 and $195 levels.
Ethereum price is currently recovering from new lows versus the US Dollar, while struggling vs bitcoin price. ETH price might continue to slide if it fails to surpass $195.
Ethereum Price Analysis
Yesterday, there was a nasty decline in bitcoin price below the $10,000 support. ETH price also declined heavily below the $200 and $190 support levels. Later, the price gained bearish momentum below the $185 support level. Moreover, there was a break below the $180 level and a close below the 100 hourly simple moving average. Finally, the price traded to a new swing low at $174 and recently started an upside correction.
There was a break above the 23.6% Fib retracement level of the downward move from the $210 high to $174 low. Moreover, the price is currently showing positive signs above the $182 and $185 levels. However, there are many important resistances on the upside near the $190 and $192 levels. Besides, the 50% Fib retracement level of the downward move from the $210 high to $174 low is also near the $192 level.ETH Technical Indicators
Hourly MACD – The MACD for ETH/USD is slowly moving in the bullish zone.
Hourly RSI – The RSI for ETH/USD is currently struggling to stay above the 50 level.


