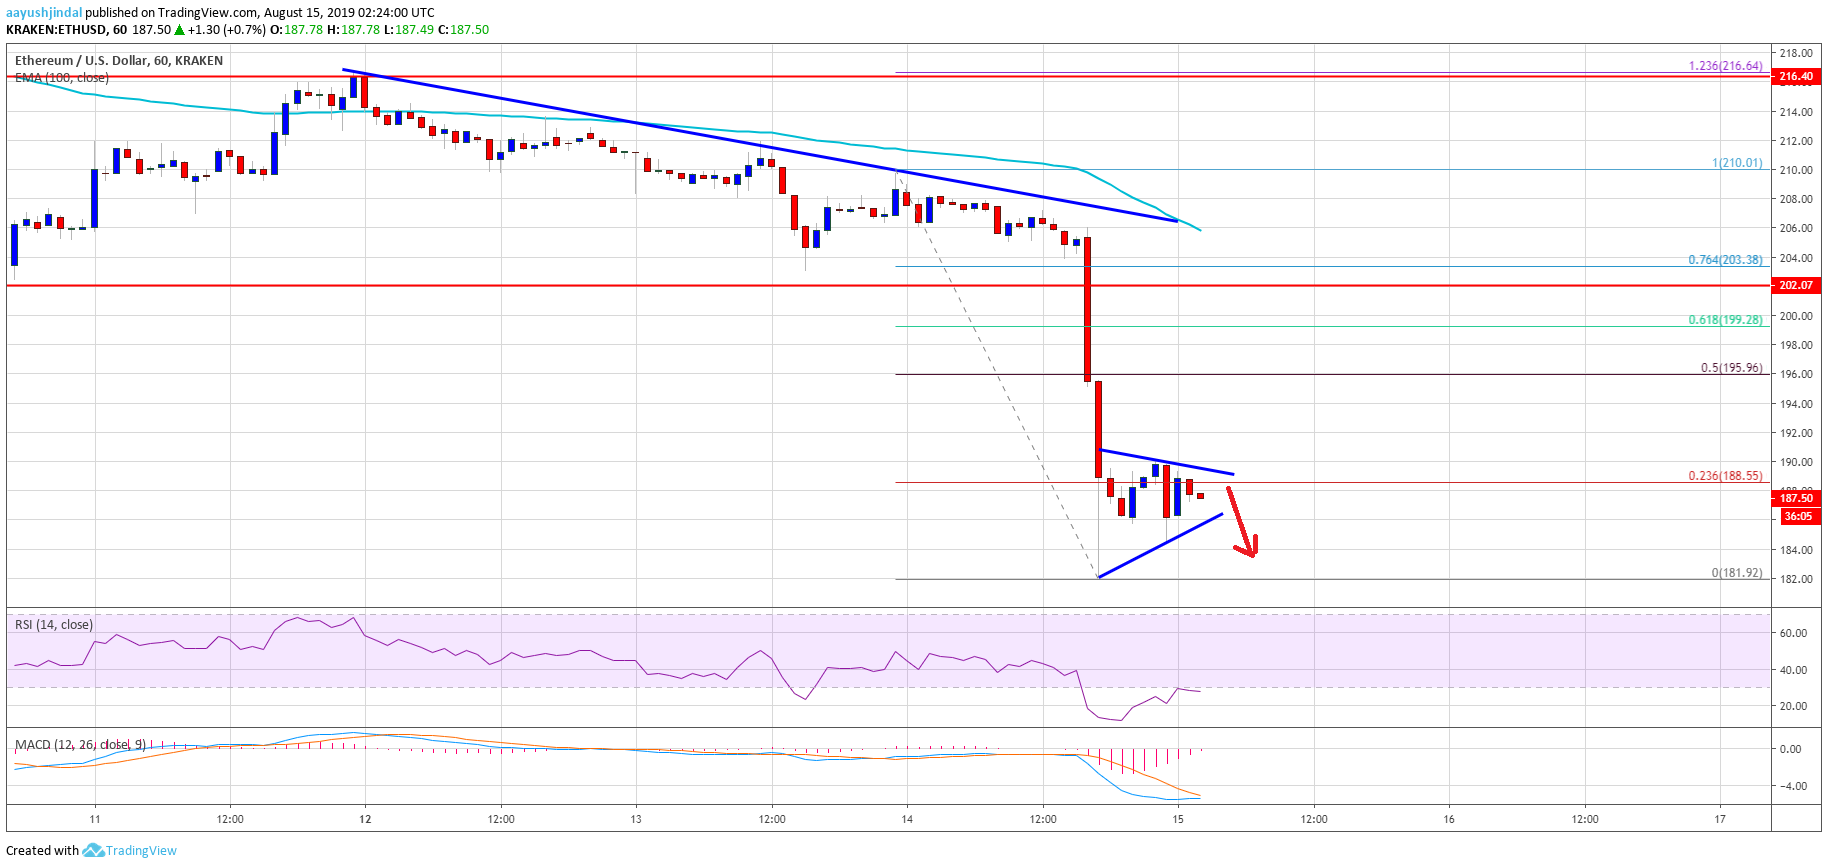
- ETH price started a strong decline after it failed to surpass the $210 resistance against the US Dollar.
- There was a break below the key $200 and $190 support levels.
- Yesterday’s highlighted key bearish trend line is intact with resistance near $206 on the hourly chart of ETH/USD (data feed via Kraken).
- The pair is currently consolidating losses above $185 and remains at a risk of more downsides.
Ethereum price is down more than 10% versus the US Dollar, following bitcoin price slide. ETH price is now trading in a bearish zone and it could even test the $180 level.
Ethereum Price Analysis
Yesterday, we saw a sharp decline in bitcoin price below the $11,000 support. However, ETH price remained stable above the $200 level. Later, BTC extended its decline below $200, which sparked a sharp selloff in Ethereum price. As a result, there was a break below the key $202 and $200 support levels against the US Dollar. More importantly, the price broke the $192 support and settled below the 100 hourly simple moving average.
A new weekly low was formed near $181 and the price is currently consolidating losses. It is trading near the $188 level plus the 23.6% Fib retracement level of the recent slide from the $210 high to $181 low. On the upside, there are many hurdles near the $192 and $195 levels. Moreover, the 50% Fib retracement level of the recent slide from the $210 high to $181 low is also near the $195 level.ETH Technical Indicators
Hourly MACD – The MACD for ETH/USD is slowly reducing its bearish slope.
Hourly RSI – The RSI for ETH/USD is currently recovering from the oversold readings.


