- ETH price broke a major resistance area near $133-134 to climb higher against the US Dollar.
- The price settled above the key $134 resistance to move into a positive zone.
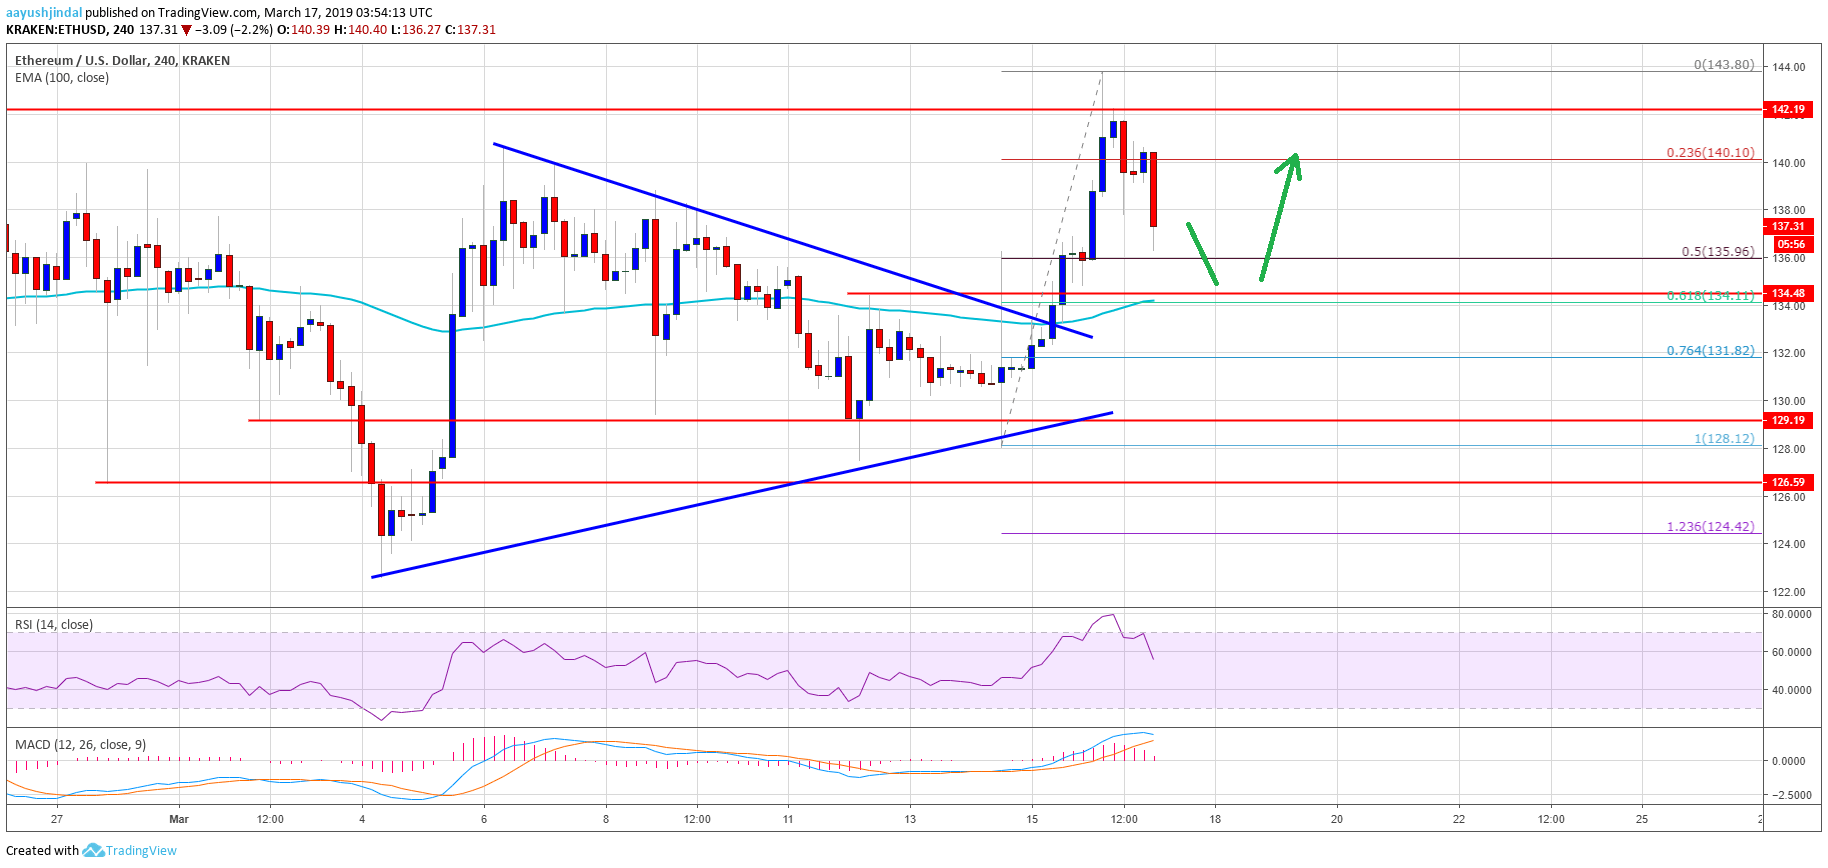
- There was a break above a major contracting triangle with resistance at $133 on the 4-hours chart of ETH/USD (data feed via Kraken).
- The pair is currently correcting lower, but it is likely to find a strong buying interest near $134.
Ethereum price is trading with a bullish bias versus the US Dollar and Bitcoin. ETH/USD climbed towards $144 and it is currently correcting lower towards key supports near $134.
Ethereum Price Analysis
This past week, there was a couple of swing moves towards the $128 level in ETH price against the US Dollar. Later, the ETH/USD pair formed a solid support near the $129 and $130 levels. Finally, buyers gained traction and broke the $132 resistance area to move into a positive zone. The upside move was strong as the price even broke the $134 level and the 100 simple moving average (4-hours). The price action was constructive, opening the doors for more upsides above the $134 level.
Moreover, there was a break above a major contracting triangle with resistance at $133 on the 4-hours chart of ETH/USD. The pair rallied above the $140 resistance level. It traded close to the $144 resistance zone. A high was formed just below $144 and later the price started a downside correction. It broke the 23.6% Fib retracement level of the last wave from the $128 low to $144 high. On the downside, there are many supports near the $135 level and the 100 simple moving average (4-hours).