TradFi Depth Oscillator Has Hit A Low And Is Now Turning Back Up
As explained by an analyst in a CryptoQuant , the volume depth in traditional finance markets has been low recently.The “TradFi volume” is a measure of the total amount of transactions that buyers and sellers are making on the US stock market.
Using an oscillator, the cyclical trend in the depth of any asset can be noticed. Here is a chart that shows how the US stock market volume depth oscillator has changed its values during the last few months:

The value of the metric seems to have been turning around in recent days | Source:As you can see in the above graph, the quant has marked the relevant zones of trend between the Bitcoin price and the TradFi volume depth oscillator. It looks like whenever the indicator has transitioned from positive to negative values, the value of the crypto has observed bearish winds.
Bitcoin Price
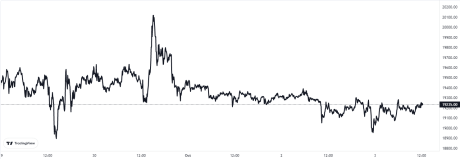
At the time of writing, Bitcoin’s price floats around $19.2k, up 2% in the last seven days. Over the past month, the crypto has lost 4% in value.
The below chart shows the trend in the price of the coin over the last five days.
Looks like the value of the crypto has been stuck in consolidation during the past few days | Source:
Featured image from Traxer on Unsplash.com, charts from TradingView.com, CryptoQuant.com


