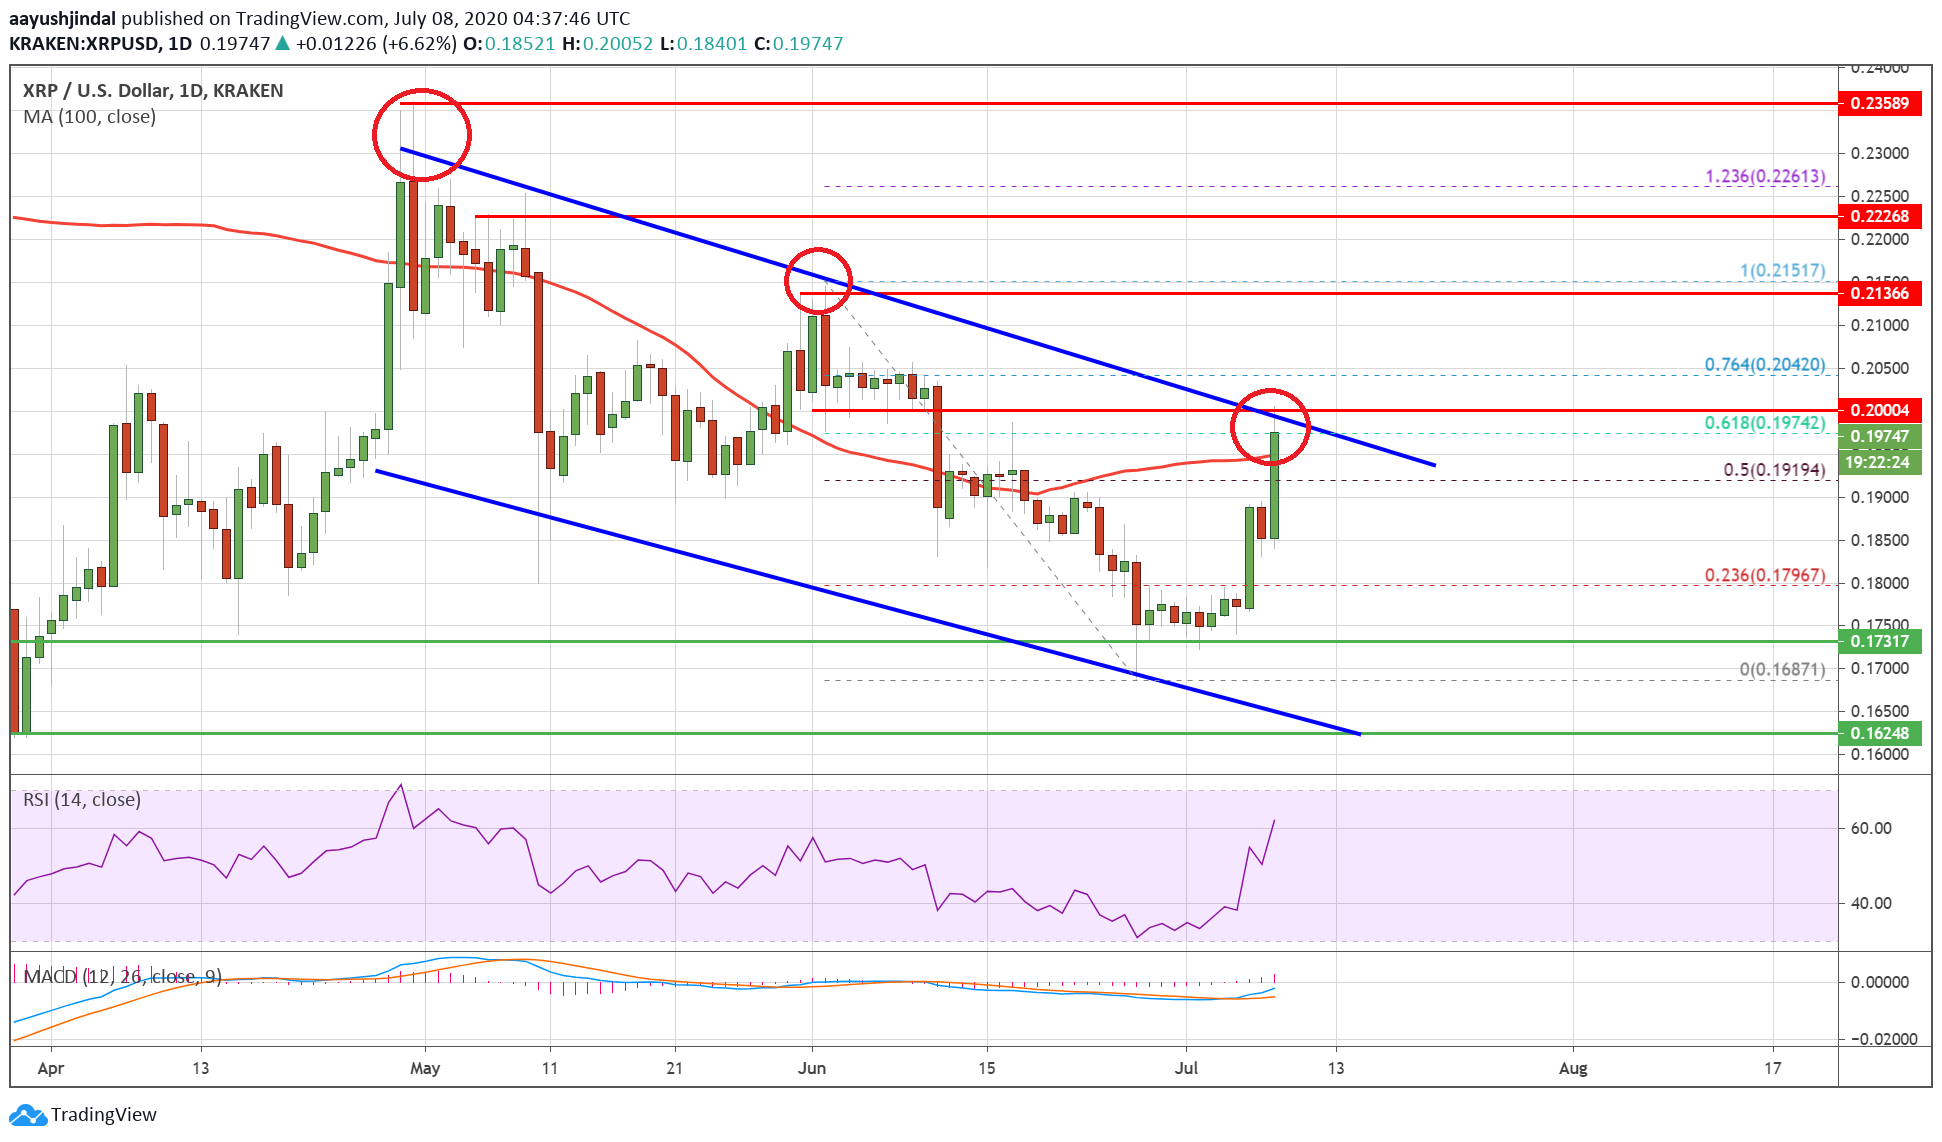
Ripple rallied around 5% and it broke the key $0.1920 resistance against the US Dollar. XRP price is now testing the $0.2000 resistance, which holds the key for a larger upward move.
- Ripple price is trading with a strong bullish bias above the $0.1900 level against the US dollar.
- The price is up close to 5% and it tested the $0.2000 resistance area.
- There is a crucial declining channel forming with resistance near $0.2000 on the daily chart of the XRP/USD pair (data source from Kraken).
- The main hurdle for the bulls is near the $0.2000 area and the 100-day SMA.
Ripple Price Rally Facing Significant Hurdle
This past week, ripple formed a strong support above the $0.1720 level against the US Dollar. XRP started a solid upward move from the $0.1687 swing low and broke many hurdles near $0.1820.
There was a break above the key $0.1900 resistance, opening the doors for more upsides. The pair spiked above the $0.1950 level and the 100-day simple moving average. Moreover, it broke the 50% Fib retracement level of the key downward move from the $0.2151 high to $0.1687 low.
The price ran into a major resistance zone at $0.2000. There is also a crucial declining channel forming with resistance near $0.2000 on the daily chart of the XRP/USD pair.
Ripple price tests $0.2000. Source:
The channel resistance is close to the 61.8% Fib retracement level of the key downward move from the $0.2151 high to $0.1687 low. Therefore, an upside break above the $0.2000 level is must for more gains in the coming days.
If there is a daily close above $0.2000, the price could start another rally. The next key resistance is near the $0.2150 level, above which it could revisit the $0.2200 level.
Bearish Rejection in XRP
If there is no upside break above the $0.2000 resistance zone, there is a risk of a bearish reaction. An initial support is near the $0.1900 level.
If ripple fails to stay above the $0.1900 level, the price is likely to resume its decline. In the mentioned case, it could revisit the $0.1820 level in the near term.
Technical Indicators
Daily MACD – The MACD for XRP/USD is gaining momentum in the bullish zone.
Daily RSI (Relative Strength Index) – The RSI for XRP/USD is currently well above the 55 level.
Major Support Levels – $0.1920, $0.1900 and $0.1820.
Major Resistance Levels – $0.2000, $0.2150 and $0.2200.
Risk disclaimer: 76.4% of retail CFD accounts lose money.


