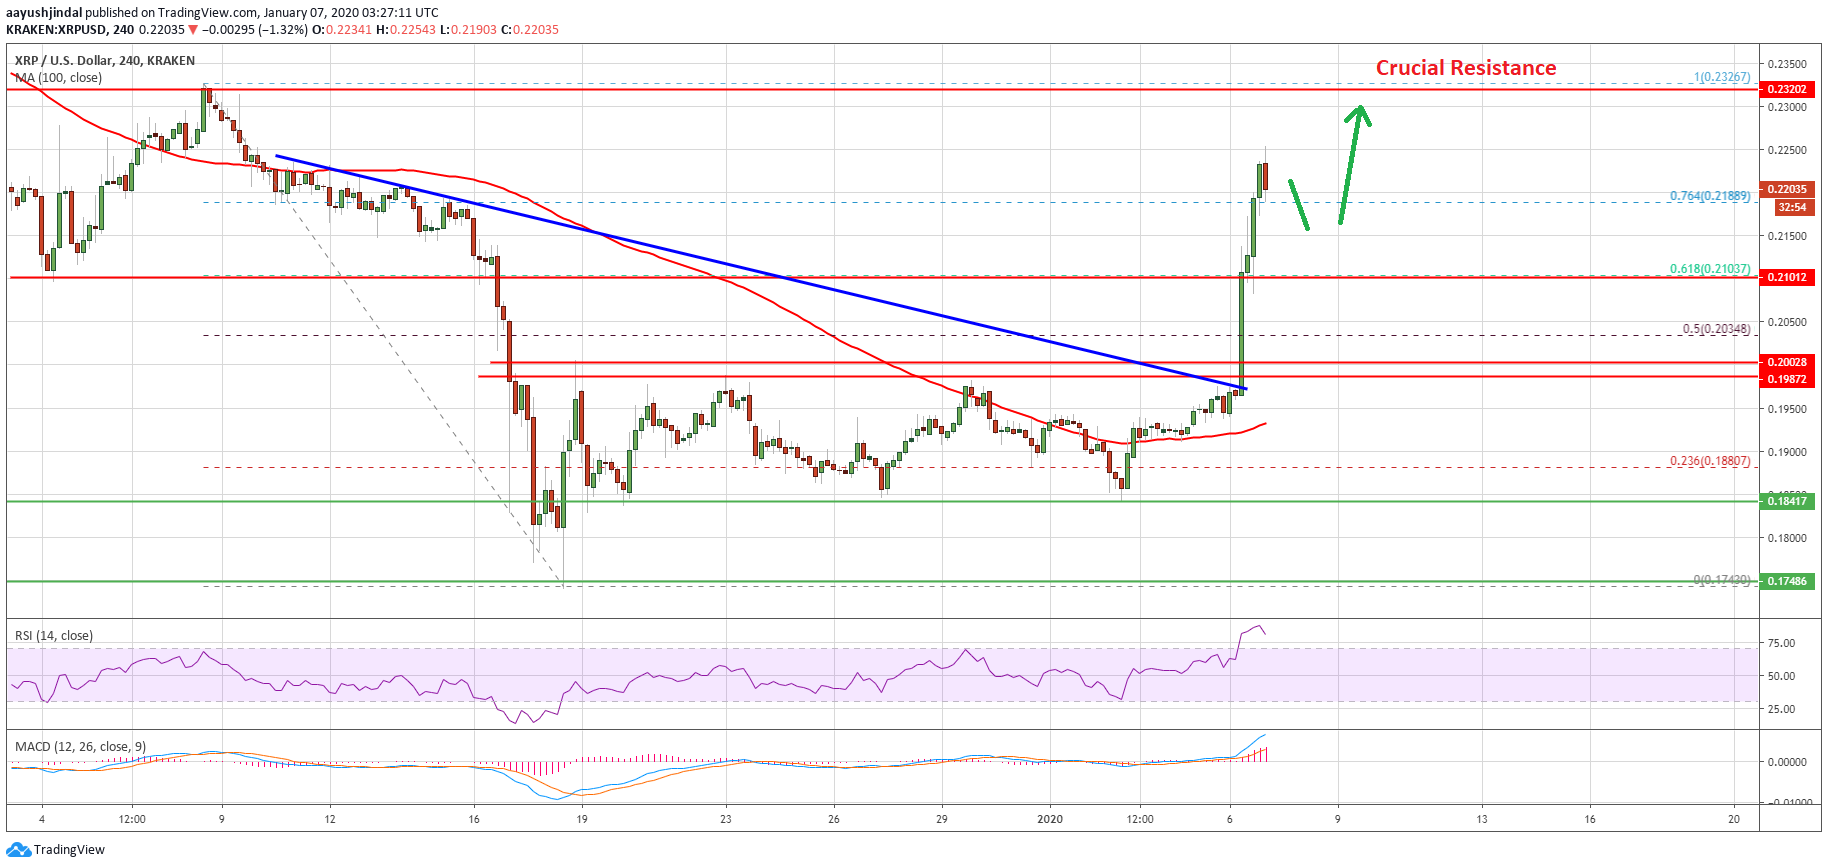
Ripple rallied more than 15% after it broke the key $0.2000 resistance against the US Dollar. XRP bulls now aim $0.2320 or $0.2400, considering the current market sentiment for bitcoin.
- Ripple price surged above the $0.2000 and $0.2120 resistance levels against the US dollar.
- Bitcoin also gained more than 5% and tested the main $8,000 resistance.
- There was a break above a major bearish trend line with resistance near $0.1985 on the 4-hours chart of the XRP/USD pair (data source from Kraken).
- The first bullish target of $0.2120 was achieved and now the bulls seem to eye a test of $0.2320.
Ripple Price Rally Is Likely Not Over
Yesterday, we discussed the chances of a massive pump in ripple towards $0.2100 against the US Dollar. XRP did break the $0.2000 resistance and rallied more than 15%.
More importantly, it broke many hurdles on the way up, including $0.2050 and $0.2120. Besides, there was a break above a major bearish trend line with resistance near $0.1985 on the 4-hours chart of the XRP/USD pair.
The price surged above the 61.8% Fib retracement level of the key downward move from the $0.2326 high to $0.1743 low. Finally, the price tested the $0.2250 resistance and it is currently consolidating gains.
It seems like the recent upsurge in bitcoin towards the $8,000 resistance stalled gains in ripple. However, the price is now trading above the 76.4% Fib retracement level of the key downward move from the $0.2326 high to $0.1743 low.
Therefore, there are high chances of another push towards the $0.2320 resistance area (Dec 2019 swing high). If the bulls succeed in pushing the price above $0.2320, the final target could be $0.2400 in the near term.
Resistance Turned Support for XRP
If there is a downside correction, ripple remains well supported near the $0.2150 level. The first key support is near the $0.2100 area (the recent breakout resistance zone).
The main support for the current uptrend is near the $0.2000 area, which acted as a strong resistance in the past few weeks.

Looking at the , ripple price is likely to continue higher towards the $0.2320 resistance area in the coming days. However, a convincing break and follow through above $0.2320 might be difficult unless bitcoin rallies above $10,000.
Technical Indicators
4-Hours MACD – The MACD for XRP/USD is gaining momentum in the bullish zone.
4-Hours RSI (Relative Strength Index) – The RSI for XRP/USD is currently correcting lower from 85.
Major Support Levels – $0.2150, $0.2100 and $0.2000.
Major Resistance Levels – $0.2250, $0.2320 and $0.2400.


