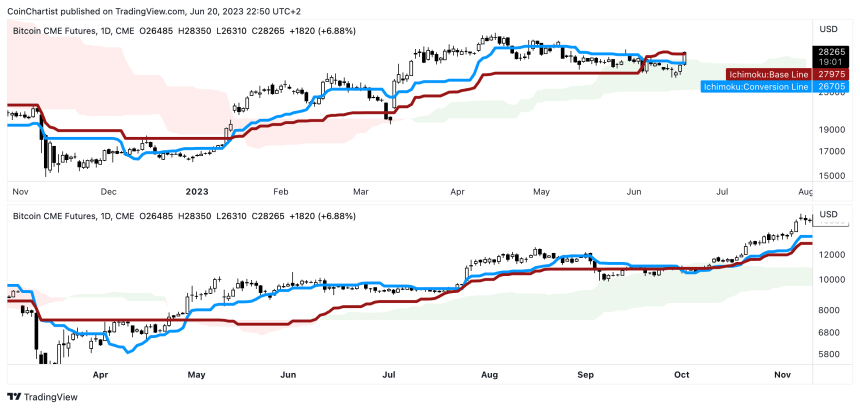
Bitcoin price has made an intraday move higher, pushing above the Ichimoku cloud on BTC CME Futures daily charts.
This signal in the past sent the entire cryptocurrency market soaring higher. Will crypto once again continue to storm ahead, or is it about to rain more pain on investors?
Bitcoin Storms Above $28,000 After Technical Breakout
BTCUSD made a 4% move higher today. While the number is rather insignificant, the minor rally was enough for a major breakout of the Ichimoku cloud on daily timeframes.
Related Reading
Importantly, the signal has only appeared on BTC CME Futures daily charts thus far. On spot BTCUSD charts, Bitcoin has a little more to climb. However, the breakout on the BTC1 continuous contract chart could be a prelude of what’s to come.
Shortly after price action peeked above the top of the cloud, the top cryptocurrency by market cap immediately stormed toward $28,000 per coin. And if history is anything to go by, sky could be the limit on higher prices.

Bitcoin has breached above the cloud |
Why Blasting Above The Cloud Could Mean Liftoff For Crypto
The Ichimoku cloud consists of Senkou span A and B. When these two spans twist it turns the cloud from green to red, or from red to green. The cloud itself also expands and contracts based on price volatility, and can act as support and resistance.
Related Reading
Bitcoin escaping the Ichimoku cloud was a crucial breach of dynamic resistance. In the comparison above, BTC leaving the cloud in 2020 led to the most recent bullish rally in crypto. In 2021 after the second top at $68,000 per coin, Bitcoin then retested the cloud and fell right through it.
This time, not only did the retest hold, but today’s rally just pushed BTC CME Futures daily chart above the cloud, the Tenkan-sen, and the Kijun-sen. This means that according to the Ichimoku, there is very little daily resistance left. If Bitcoin does behave like the last time it left the cloud, it could be time for liftoff.
Tony is the author of the . Follow & on Twitter. Or join the for daily market insights and technical analysis education. Please note: Content is educational and should not be considered investment advice. Featured image from iStockPhoto, Charts from


