Bitcoin Supply Last Moved Within 30 Days Has Been Relatively Low
As per the latest weekly report from , despite a rise in BTC’s price recently, the supply moved within the last 30 days hasn’t risen much. The percentage of Bitcoin supply last moved in the past 30 days is an important indicator that tells us about the liquidity of the market.Usually, when coins start aging more, they become less likely to be moved. Because of this reason, a low proportion of short-term supply implies low liquidity in the market. This can be a bullish signal for BTC.
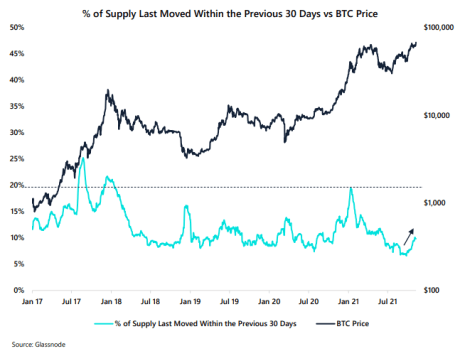
On the other hand, if a high percentage of Bitcoin supply is young, then the liquidity would be high. This may be a sign of bearish trend. Based on the trend of the indicator, it may be possible to tell whether the market is nearing a peak or not. Here is a chart that shows how the value of the BTC young supply has changed since 2017:
Looks like the current percentage of supply moved in the last thirty days is relatively low | Source:The above graph shows some interesting features between the indicator and the Bitcoin price during the two bull runs of 2017 and 2018.
Related Reading | Bitcoin Sentiment Suggests Serious Greed, But Will A Correction Come?
Related Reading | S2F Creator PlanB Believes In $98k Nov Target For Bitcoin
Currently, the short-term supply is sitting at a healthy 10%, which means it has enough room to grow still, despite already making a new ATH. This means that if Bitcoin’s strength remains, the market can still grow before hitting a top.
BTC Price
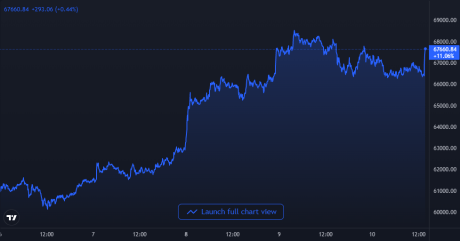
At the time of writing, Bitcoin’s price floats around $68.2k, up 10% in the last seven days. Over the past month, the crypto has gained 18% in value.
Below is a chart that shows the trend in the price of the coin over the last five days.
BTC's price has made a new ATH above the $68k mark | Source:
Featured image from Unsplash.com, charts from TradingView.com, Arcane Research


